
Evolution and Forecasting of the Renewable Energy Consumption in the Frame of Sustainable Development: EU vs. Romania


1
Department of Statistics and Economic Informatics, University of Craiova, A.I. Cuza 13, 200585 Craiova, Romania
2
Department of Mathematics, University of Craiova, A.I. Cuza 13, 200585 Craiova, Romania
3
Department of Management, Politehnica University of Timisoara, Piata Victoriei 2, 300006 Timisoara, Romania
*
Author to whom correspondence should be addressed.
Sustainability 2021, 13(18), 10327; https://doi.org/10.3390/su131810327
Submission received: 11 August 2021
/
Revised: 9 September 2021
/
Accepted: 13 September 2021
/
Published: 15 September 2021
Abstract
:This article is part of the concerns generated by the need to increase the consumption of renewable energy, so that in the European Union (EU) countries, its share in the final energy consumption, to reach 32% by 2030, increases. In the context in which, in the specialized literature, the analysis of renewable energy consumption by activity sectors is approached very little, such an analysis has high utility. The variables of interest are the share of renewable energy in the final energy consumption, and the share of renewable energy sources in the final energy consumption in transport, electricity, and heating and cooling. The study performs a comparative analysis of the evolution of these indicators for the period 2004–2019 for Romania and the EU, an empirical estimate of the evolution of indicators using time regression and autoregressive models, a forecast of the share of renewable energy consumption in the final energy consumption and by the main sectors (transport, electricity, and heating and cooling) for the 2030 horizon, providing appropriate scenarios for achieving the EU established goals, as well as an analysis of the interdependence between the indicators. Through the results obtained, the paper can contribute to improving the framework for the sustainable development of energy consumption.
1. Introduction
One of the objectives set by the 2009 Renewable Energy Directive [1] was to achieve 20% renewable energy in the final energy consumption by 2020, for the European Union (EU) and at the level of each member state. The share of renewable energy in the final energy consumption in the EU increased from 12.6% in 2009 to 18% in 2018, approaching the set target. The situation is very different for the EU member states; some have exceeded the target (Sweden, Finland, Denmark, Estonia, etc.), but others are still far from reaching the target (France, Germany, Spain, the Netherlands, etc.) [2]. In these conditions, in December 2018, the EU presented a new directive on renewable energy [3], setting a goal to reach a share of 32% of renewable energy consumption in the final energy consumption by 2030.
At the same time, Europe aims to become a climate-neutral continent by 2050 [4], by achieving a sustainable green transition. In this respect, the EU considers that renewable energy sources can play a very important role, and sets a target that by 2050, at least 80% of its energy will come from renewable sources [5].
“Energy from renewable sources” or “renewable energy” are defined as “energy from non-fossil renewable energy sources, namely wind, solar and geothermal energy, environmental energy, tides, waves and other ocean energy, hydropower, biomass, gas for landfills, wastewater treatment plants and biogas” [3].
Renewable energy is energy that is collected from renewable resources that are naturally replenished. Thus, the widespread use of renewable energy resources would lead, in addition to reducing pollution, due to the energy from fossil sources, to an increase in energy security. Renewable energy is the fourth largest source of energy, after nuclear energy, oil products, and gas [6]. This motivated the analysis of renewable energy from political, technical, economic, and social perspectives [7], to identify the opportunities and challenges posed by the increase in renewable energy consumption [8].
Energy consumption is the premise of economic development, and it can accelerate climate change. Thus, more and more countries are considering sustainable economic development and long-term environmental conservation, which requires the widespread use of energy from renewable sources [9,10,11,12,13,14,15]. At the same time, an increase in renewable energy production, alongside a reduction in energy consumption, are vital for the sustainable development of any state [16,17].
Due to the importance of renewable sources, several studies have investigated the main factors that can lead to the increased use of renewable energy [18,19,20,21,22,23,24,25], and may have implications on the energy policies. In this way, the EU member states governments have some of the following instruments at their disposal, to promote the use of renewable energy: orienting public policy to support the energy transition and the implementation of renewable energy [26,27,28]; increasing the prices of fossil fuels; and lowering the price of energy from renewable sources [29,30]. Thus, many studies emphasize the importance of achieving an appropriate energy policy that is in favor of renewable energy sources [31,32].
The effects of the COVID-19 pandemic were also experienced by energy consumption, amid a decrease in it. However, there is an increase in renewable energy consumption, so, at this time, the decisions of policy makers, in connection with the further development of renewable energy, are very important.
At the same time, there is an increase in renewable energy consumption, so, at this moment, the decisions of political factors are very important, in connection with the further development of renewable energy consumption [33,34].
Although renewable energy plays a vital role in achieving environmental sustainability, increasing its consumption varies from country to country, depending on the share of renewable energy sources in the energy mix [35,36]. Various studies show that less-developed countries, and those that joined the EU later, have been more open to switching to renewable energy consumption than developed countries [37,38,39,40].
The total share of energy from renewable sources in the final energy consumption includes the contribution of the renewable energy of each sector to the final energy consumption, namely, the electricity sector, the heating–cooling sector, and the transport sector. Given the heterogeneous behavior of these sectors in the final energy consumption, the analysis of the share of energy from renewable sources in the final energy consumption requires the analysis of the contribution of the renewable energy of each sector.
Globally, most renewable energy sources are consumed in the residential, commercial, and public services sectors. The electricity and heat sector account for 40.5% of the global renewable energy consumption, while 39.6% is used in the residential, commercial, and public sectors [41].
The analysis of renewable energy consumption by activity sectors is rarely addressed in the literature; therefore, the objectives of this paper are to review the validation framework of the results of increasing the share of renewable energy consumption in the final energy consumption, totally and by components, as well as to identify the trend of this share in the short and long term, and to observe the degree of involvement of the renewable energy consumption of each sector in the final energy consumption. Thus, this research aimed at achieving the following four objectives:
- Statistical analysis of the evolution of the indicators for the period 2004–2019, including a comparison between the EU and RO;
- Analysis of the evolution of indicators through polynomial regression over time, and autoregressive models;
- Forecast of the trend of indicators for the period 2020–2030;
- Analysis of the interdependence between indicators through a multilinear regression model.
To achieve these objectives, we collected data related to the period 2004–2019, regarding the following indicators: the share of renewable energy in the final energy consumption (RE), the share of renewable energy sources in the final energy consumption in transport (RE_T), the share of renewable energy sources in the final energy consumption in electricity (RE_E), and the share of renewable energy sources in the final energy consumption in heating and cooling (RE_H&C).
In order to estimate the evolution and the forecast of the trend of the indicators, we formulated the following two working hypotheses:
Hypothesis 1 (H1).
The possibility to achieve the targets for the share of renewable energy consumption in the final energy consumption and by sectors by 2030, for the EU and RO;
Hypothesis 2 (H2).
The share of renewable energy consumption in each sector has an equal contribution in the share of renewable energy consumption in the total energy consumption.
The outline of the paper is as follows: Section 2 presents a literature review regarding the share of renewable energy consumption in the final energy consumption; Section 3 describes the models and methodology used; Section 4 presents the statistical analysis of the data and the evolution of these indicators; Section 5 contains the empirical estimations of the evolution, using polynomial time regression and autoregressive models for each indicator, then the estimated models are used to predict the short-term evolution of the variables, giving an answer to hypothesis H1, and achieving objectives two and three; in Section 6, the interdependence between the indicators is analyzed by means of a multilinear regression model, giving an answer to hypothesis H2 and achieving the last objective; Section 7 is reserved for the discussions, and summarizes the main conclusions.
The models used are statistically validated and their estimates provide possible scenarios for the evolution of the analyzed indicators, and they are suitable for reaching the targets set by the European Directives for the 2030 horizon.
Through the obtained results, this study may constitute premises for other researchers to conduct subsequent research in this area.
2. Literature Review Regarding the Renewable Energy Consumption Share in Final Energy Consumption
Renewable energy consumption in the EU member states has been analyzed by several authors, who, either considering the factors that can stimulate this consumption or the impact that it has on sustainable development, found that some countries have achieved relevant results, but others must be supported further [42,43,44]. The year 2020 marked an important milestone for sustainability, as, for the first time, Europe produced more energy from renewable sources than fossil fuels, while 38% of EU electricity consumption came from renewable energy sources [45].
Heating and cooling play a key role in achieving the EU’s goal of moving towards a clean and carbon-neutral economy by 2050, given that it accounts for half of the EU’s energy consumption. The electrification of transport, as well as heating, can lead to significant emission reductions, and more-flexible management of electricity demand. This can lead to increased penetration of renewable energy sources in these sectors [46]. In this regard, in recent years, renewable energy has begun to become more competitive in the fields of heat and electricity. Thus, in France, there has been a significant increase in renewable energy consumption in the transport and heating sectors, since 2012 [6].
2.1. Heating and Cooling Sector (H&C)
In the energy consumption for the heating and cooling sector (H&C), the highest share is represented by heating and hot water (79%), with the cooling having a rather small share. According to the Eurostat statistics in 2019, about 75% of heating and cooling was still generated from fossil fuels, while only 22% was generated from renewable energy [47]. Thus, to achieve the targets set by the European Commission for 2030, according to which the share of renewable energy consumption in H&C in total heating and cooling energy consumption must reach 32%, member states are required to strive for an average annual increase of 1.3% between 2021 and 2030, for renewable energy in the H&C sector [3].
The consumption of renewable energy for heating and cooling has been insignificant for a long time in most EU member states. The increase in the share of renewable energy consumption in the final energy consumption in this sector has been quite slow compared to the electricity sector. However, the use of energy from renewable sources for heating and cooling demonstrates several economic benefits [48]. Thus, renewable energy consumption in the H&C sector is expected to reach a share of almost 30% of the total heat consumption by 2020, and to cover more than half of the EU’s heat demand by 2030 [49].
Many studies have carried out a comparative assessment of the sustainability of the heating sector at the national level, in some countries [50], highlighting the important contribution of energy consumption from renewable sources, to achieve the EU objectives [51]. At the same time, some authors consider that buildings contribute, with over 30% of the global final energy consumption, which implies the necessity for the rapid penetration of renewable energy technologies in this sector [52,53,54,55].
2.2. Electricity Sector
The EU’s long-term vision by 2050 implies a sustained increase in the electrification process, which would lead to an increase in the share of electricity in the final energy consumption, from 20% in 2018 to 53% by 2050 [5].
Currently, electricity around the world is increasingly generated from renewable sources. Globally, about a quarter of electricity comes from renewable sources. Due to the decline in economic activity and the general decline in energy demand in the EU during the COVID-19 pandemic lockdown, renewable energy production took over the lead as an energy source, to the detriment of coal. Thus, a faster transformation of the EU energy system is expected in the next decade, to reach the target of increasing the share of renewable energy consumption to 32% in the final energy consumption, by 2030. This implies reaching a share of 50% of renewable electricity consumption in the final electricity consumption [56].
Renewable energy that is used in electricity has, so far, been the most resistant energy source; it was not affected by the lockdown measures imposed by the COVID-19 pandemic. At the same time, the COVID-19 crisis is influencing states to make the transition to clean energy. The COVID-19 crisis has led to new records being set for the integration of renewable energy into the electricity grid in the major energy-consuming countries (Italy, Germany, and Spain). Renewable energy sources are now becoming the main source of electricity production in the EU [57].
2.3. Transport Sector
Transport plays a vital role in the world economy, facilitating human movement and global trade. Although it accounts for a third of the global energy demand, it is the sector with the lowest level of renewable energy use, but with the greatest potential. The EU has been promoting the use of renewable energy (including electricity) in the transport sector since 2009 [1], requiring that both the EU and all the member states reach a 10% share of renewable energy consumption in the final energy consumption by 2020.
The EU RED II Directive [58] maintains and even sets higher national targets (14%) for renewable energy consumption in transport for 2030 (at the request of the member states).
Several studies have been carried out to assess the possible future development of clean energy consumption in the transport sector, in order to achieve a climate-neutral Europe by 2050 [59].
In 2017, the majority of energy consumption in the transport sector came from fossil fuels, oil products accounted for 94% of the total energy consumed in this sector, and the share of renewable electricity consumption in the transport sector in the EU was 33% [60]. Thus, to achieve the goal for 2030, of using renewable energy in transport, the European Union relies heavily on electrification and on targeting the population, in particular, towards the use of electric vehicles. By 2019, the electrification of transport has advanced at a fairly slow pace in the EU (implementation of approximately 1.3 million electric vehicles in 2018) [61].
The study of scenarios of various fuel combinations for transport has led to the conclusion that the use of a large proportion of renewable sources (40%) will be able to ensure the achievement of the targets set by the EU for 2030 [62].
An important aspect in the European Union is currently the increase in electricity consumption in the transport sector, through the penetration of electric vehicles [63].
2.4. Renewable Energy Consumption in Romania
According to the Paris Agreement on climate change, the European Union is committed to provide clean energy throughout the EU. In order to meet this commitment, one of the targets set for energy and climate in 2030 is to increase the share of renewable energy consumption to 32% in the final energy consumption. To ensure that this objective is met, each member state has set its own national objectives and contributions, based on the European Commission’s recommendations. Romania ranks the 10th in Europe in green energy consumption, with a share of renewable energy consumption in the final energy consumption of 23.8% in 2018, above the 20% target set by the EU for 2020 [2].
According to the new regulations set by the EU, Romania’s objective regarding the share of renewable energy consumption in the final energy consumption is for it to reach 30.7% by 2030 [66], below the recommended level of 34% by the governance regulation [67].
Concerning the share of energy consumption from renewable sources by sectors, by 2030, the largest share should reach the electricity sector, of almost 50% (49.4%), followed by the H&C sector, with a share of 33%, and for the transport sector, the European target of 14.2% for the final transport energy consumption has been set (Figure 1).
Exploring the existing literature, we found that the analysis of renewable energy consumption by sectors of activity is quite little addressed, therefore, such an analysis is welcome. At the same time, the degree of involvement of renewable energy consumption in each sector in the final energy consumption in the European Union is not addressed, thus this study can improve the literature.
3. Data, Models and Methodology
The macroeconomic indicators used for the analyzes performed in this study are as follows:
- Share of renewable energy in final energy consumption (RE);
- Share of renewable energy sources in the final energy consumption in transport (RE_T);
- Share of renewable energy sources in the final energy consumption in electricity (RE_E);
- Share of renewable energy sources in the final energy consumption in heating and cooling (RE_H&C).
All the indicators are expressed as a percentage (%), and they measure the share of renewable energy consumption in the final energy consumption and three sectors of final energy consumption. The values of these indicators, for the EU-27 and Romania, were taken from the Eurostat database [68]. As data were only available for the period 2004–2019, the study was carried out for this period.
In the empirical estimations, we used the notations RE_EU and RE_RO to differentiate between the shares of renewable energy in the final energy consumption for the EU and Romania, respectively.
The study is structured in three parts. First, for each of the indicators, we performed a statistical analysis of the evolution over the period 2004–2009. Second, we empirically estimated the evolution of each indicator by means of polynomial time regression and autoregressive models. Next, the estimated models were used to forecast the short-time evolution of the variables. The third part of the study aimed to emphasize a long-term relationship between the indicators, by means of a multilinear regression model.
The statistical analysis performed in Section 4 relies on the usual statistical instruments.
For the first part of the empiric analysis in Section 5, we used the following linear time regression model:
and the following quadratic model:
where is the discrete time, is the response variable at the time , are the regression coefficients that need to be estimated, and is the error term. While the linear model (1) only provides a general trend for the data, either decreasing, increasing, or stationary, the quadratic model (2) also gives information on the evolution of the variation in the variable.
If are the estimated parameters, the predicted value of the variable is , or , respectively, and the difference is the residual value at time .
The least squares method (LSM) was used to find the regression parameters, that is, the values of the coefficients for which the sum of squared errors has a minimum value. The quality of the estimation can be assessed by analyzing the several functions that depend on the estimation errors, such as the coefficient of determination , the Akaike information criterion (AIC), or the Schwartz criterion.
The autoregressive models used the expression of the interest variable as a function of the previous terms . As the time series contained a small amount of data, we only used the first- and second-order autoregressive models, namely, the following:
and the following:
.
If are the estimated parameters, the predicted values of the variable, using model (3), are satisfiable.
Equation (5) generates a discrete dynamical system of order 1, with the fixed point , if . The fixed point is stable if the absolute value of the root of the characteristic equation is smaller than 1, i.e., . In this case, the model is also called stationary.
The predicted values of the variable, using model (4), satisfy the following:
which generates a discrete dynamical system of order 2. The fixed point , if , is stable if the roots of the characteristic equation lie inside the unit circle.
The validation of the models was realized by tests on the estimated parameters and on the residuals (Durbin–Watson test, White test, and Jarque–Bera test).
Using the estimations of the four proposed models, we performed short-time forecasting for the considered indicators, for both the EU data and for the Romania data, and compared them to the values established in the EU Directive [3].
The third component of the study, in Section 6, aims to establish, using statistic methods, the interdependence between these indicators. Motivated by the fact that RE_T, RE_E, and RE_H&C are components in the final energy consumption structure, we set out to analyze the following multilinear regression model:
Here, refers to the time, while represents the estimation error.
The empirical analysis of this model consisted of the following steps: (i) validation of the model; (ii) estimation of the parameters; and (iii) interpretation of the results. Model reliability analysis involved firstly testing the stationarity and the order of integration of the variables, by means of unit root tests (such as augmented Dickey–Fuller [69]), then testing the existence of a co-integration relationship between the variables, by means of the Johansen maximum likelihood method [70,71]. The cointegration equation was finally validated using the White test for heteroskedasticity [72].
In addition, the Granger causality test was used to find unidirectional or bidirectional causalities between the four variables.
The parameter estimates for the regression in Equation (5) were evaluated using LSM [73].
All the models were estimated and processed using econometric, data processing, and analysis software, EViews 12.
4. Statistical Analysis of the Evolution of the Indicators
Comparing the evolution of the indicators in the analyzed period, at the EU-27 and Romania levels, both globally (RE) and for the three analyzed sectors (RE_T, RE_E, and RE_H&C), it is found that the share of renewable energy consumption in the final energy consumption at the Romania level is higher than that at the EU-27 level (except for the transport sector) (Figure 2).
At the EU-27 level, the evolution of the share of renewable energy consumption in the final energy consumption shows a permanent increase, both globally and in each sector. In 2019, RE_EU reached a value of more than double compared to 2004, achieving an increase of 104.8% (Table 1). Thus, with a share of 19.7% in 2019, the EU is approaching the achievement of the 2020 target (reaching a share of renewable energy consumption in the final energy consumption of 20%).
The analysis of the evolution of the share of energy consumption from renewable sources in the final energy consumption in Romania (Figure 2) shows that it has reached the target that has been set by the EU since 2008, achieving a share of renewable energy consumption of 20.8% in the final energy consumption (due to the government encouragement of renewable energy production in the electricity sector). After 2008, there has been an evolution that has marked alternative periods of increases and decreases. The highest value of the share was recorded in 2016 (25.3%). In Romania, the trend of the global share of renewable energy consumption in the final energy consumption in recent years has been the opposite of that of the EU-27; the share of energy from renewable sources in the final energy consumption has been steadily declining in recent years, decreasing from 25.3% in 2016 to 24.5% in 2017, reaching 23.9% in 2018, and having a slight recovery in 2019, reaching 24.3%. Despite all these variations, in 2019, it was above the EU-27 average, with over 4.5%.
Regarding the share of the consumption of renewable energy in the final energy consumption, by sectors, the trend is increasing in all the sectors, both at the EU-27 level and in Romania, but it varies significantly by sector (Table 1). It is noted that the highest increases in the EU are recorded in the transport sector (472%) and electricity sector (114.9%). In 2019, Romania registered a share of renewable energy consumption, by sectors, that was above the share from the EU level for the electricity and H&C sectors, but below the EU-27 level for the transport sector. In the transport sector, in 2004, Romania registered a higher share compared to the EU-27 level (16.90%), but in 2019, it was below the EU-27 level (decreased by 11.85%).
In the EU-27 in 2019, renewable sources provided over 34% (34.2%) of electricity consumption, and for energy consumption in the transport sector, less than 9% (8.9%), being relatively close to the EU 2020 target (10% for the share of renewable energy used in transport from the total consumption related to this sector). Renewable energy accounted for 22.1% of the final energy consumption for heating and cooling, rising from 11.7% in 2004 (an increase of 88.4%).
In Romania, in 2019, the share of renewable energy in the final energy consumption in the electricity sector was 41.7% above the EU-27 share, with 7.5 percentage points, while in the H&C sector, it was 25.7% above the EU-27 share, with 3.6 percentage points. In the transport sector, the share of renewable energy consumption in the total consumption of this sector was only 7.85% below the EU-27 average, by 1%.
Remark that the share of renewable energy in the final energy consumption at the sector level has generally been above the indicative trajectories for achieving the 2020 targets. The sector share in electricity (RE_E), and heating and cooling (RE_H&C) has been systematically above the EU targets.
During the period under review, the EU experienced a positive growth rate in the share of renewable energy consumption in the final energy consumption, even after the financial crisis in 2008–2009. However, Romania had a sinuous evolution of the annual growth rate, with significant increases and decreases, registering negative values in 2006, 2011, 2015, 2017, and 2018 (Table 1 and Figure 3).
The highest growth rate of RE at the EU-27 level was found in 2009 and 2012 (over 10%), and the lowest was in 2011, below 1% (Table 1). Romania has had a winding evolution of the annual growth rate, with significant increases and decreases. Romania recorded the highest growth rate, after it acceded to the EU in 2008 (over 11%), when the conditions imposed by the EU, on increasing the share of renewable energy consumption in the total volume of consumption, were experienced (Table 1).
The share of the consumption of electricity from renewable sources in the final energy consumption at the EU-27 level registers an annual increase over the entire analyzed time period, so that the indicator had an increase of more than double in 2019, compared to 2004. The growth rate of the share of renewable energy in the final energy consumption in the electricity sector at the EU-27 level had positive values, with the highest increase being recorded in 2009 (11.5%), and the lowest in 2016 (1.69%). At the Romania level, the indicator registers an increased rate of 46.72% in 2019, compared to 2004, but it can be observed that there are years in which there are decreasing fluctuations compared to the previous year (2006, 2008, 2010, and starting with 2016 it registered negative values each year) (Figure 4).
Regarding the share of renewable energy consumption in the final energy consumption of the H&C sector, the EU-27 only registers positive growth rates in the analyzed period, with an increase of 88% in 2019, compared to 2004. In the same period, Romania records both positive and negative values, and quite large variations in this indicator. The indicator registers a growth rate of 48.5% in 2019, compared to 2004, which is below that of the EU-27 (88.4%), and it can be observed that there are years in which there were decreasing fluctuations compared to the previous year (2006, 2011, 2015, 2017, 2018) (Figure 5).
The largest variations in the annual growth rate are registered by the transport sector, both in the EU-27 and in Romania (Figure 6). The EU-27 registered the lowest growth rate in 2011 (–26.1%), while, in the same year, Romania registered a doubling of the consumption in this sector (108.9%).
The descriptive statistical analysis of the indicators (Table 2) highlights the fact that the highest average of the analyzed indicators is registered in the electricity sector (RE_E), while the lowest average is found in the transport sector (RE_T), both for RO and for the EU-27. Close average values are recorded for RE and RE_H&C, both in RO (21.9, respectively, 23.9), but also in the EU-27 (15.1, respectively, 17.6).
The maximum and minimum values are registered by Romania, with the maximum value being at RE_E (43.2), and the minimum value being at RE_T (1.3).
The indicators RE_RO, RE_E_RO, RE_H&C_RO, and RE_H&C_EU show a relatively homogeneous dispersion, while RE_EU and RE_E_EU have a relatively heterogeneous dispersion, and in the case of RE_T, both in the EU-27 and in Romania, the dispersion is heterogeneous, but with an average representative for the eight indicators analyzed.
From the point of view of the effect of asymmetry on the average of the indicators, RE_E_EU presents a symmetrical distribution; RE_EU, RE_RO, RE_T_EU, RE_H&C_EU, and RE_H&C_RO show a slight negative asymmetry, due to the mean values below the median; and RE_T_RO and RE_E_RO register a slight positive asymmetry, where the mean values are above the medians. The shape of the distribution is platykurtic, respectively, which is a flatter distribution than the normal one, with a wider shape, because the values tend to be more dispersed, for all the indicators analyzed at the EU-27 and RO levels, but RE_T_EU and RE_H&C_RO are closer to a normal distribution.
5. Empirical Estimations and Forecasting
In this section, we aim to given answer to hypothesis H1. We estimate the regression models (1) to (4) for each economic indicator and use the results to forecast the short-term evolution.
5.1. Empirical Estimation Using Time Regression and Autoregressive Models
The results of the estimations of Equations (1)–(4), using the share of renewable energy in the final energy consumption for the European Union (RE_EU) and Romania (RE_RO) as a dependent variable, are given in Table 3.
Note that the estimated coefficients, for the linear and quadratic time models, given in Table 3, are statistically significant at a 1% significance level, as the probability for the estimated coefficients is zero, so the hypothesis that they are equal to zero is rejected. For model (3), the estimated coefficients are statistically significant at a 5% (for EU) and a 10% (for RO) significance level, while for model (4), only some of the coefficients are statistically significant.
In Figure 7, we plotted the data and the estimated regression line and parabola.
The linear estimations show an increasing trend for both the EU and Romania data, with the annual growth rate being 17% bigger for the EU data. The quadratic estimations show a non-convex trend, with the turning point located at about 2030 for the EU data, and at 2017 for the Romania data. This means that RE_EU should continue to increase, yet at a decreasing annual rate, while for RE_RO, this estimation shows a plateau, followed by a slight decreasing slope.
The estimation of the autoregressive Equation (3) has the roots and , respectively, showing stationarity towards the values RE_EU and RE_RO , respectively.
For the second-order autoregressive model (4), the roots of the characteristic equation are 0.952 and for the RE_EU data, and for the RO_EU data, and all of them are situated inside the unit cycle. Hence, both the dynamical equations evolve towards stationary points, namely, RE_EU and RE_RO , respectively.
Using the share of renewable energy in the final energy consumption in the electricity sector for the European Union (RE_E_EU) and Romania (RE_E_RO) as a dependent variable, the results of the estimations of Equations (1)–(4) are listed in Table 4.
In these cases, the estimated coefficients for the linear time models are statistically significant at a 1% significance level, while for the quadratic model, the coefficients of the term are not statistically significant, that is, the hypothesis that they are equal to zero cannot be rejected. For models (3) and (4), only the coefficient of the term is statistically significant at a 1% significance level.
In Figure A1, the estimated regression line and parabola for RE_E are plotted. Remark that the share of renewable energy consumption in electricity for Romania is above that in the EU. Both the linear and quadratic estimations show an increasing trend for both the EU and Romania data, with an annual growth rate of 1.3 for the EU data, and of 1.23 for Romania data, respectively. The quadratic estimations show a convex increasing trend.
The estimation of the autoregressive Equation (3) has the roots and , respectively, only showing stationarity for the Romania data, towards the value RE_E_RO .
For the second-order autoregressive model (4), the roots of the characteristic equation are 1.009 and for the RE_E_EU data, meaning that the process is not stationary. For the RE_E_RO data, we obtain complex roots, situated inside the unit cycle. Hence, this process evolves towards the stationary point RE_E_RO .
Next, the results of the estimations of Equations (1)–(4), using the share of renewable energy in the final energy consumption in the transport sector for the European Union (RE_T_EU) and Romania (RE_T_RO) as a dependent variable, are reported in Table 5.
In these cases, the estimated coefficients for the linear time models are statistically significant at a 1% significance level, while for the quadratic model, only some of the coefficients are statistically significant. For models (3) and (4), only the coefficient of the term is statistically significant at a 10%and a 1% significance level, respectively.
In Figure A2, the estimated regression line and parabola for the variable RE_T are plotted. Both the linear and quadratic estimations show an increasing trend for both the EU and Romania data. The annual growth rates for the linear estimation are almost the same, as 0.453 and 0.448. The quadratic estimation shows a convex increasing pattern, with an accentuated growth after 2007, which was the year when Romania became an EU member. Although RE_T_RO represented 116% of RE_T_EU in 2014, in 2019, it represented only 88%.
The estimation of the autoregressive Equation (3) has the roots and , respectively, only showing stationarity for the EU data, towards the value RE_T_EU .
For the second-order autoregressive model (4), the roots of the characteristic equation are 0.955 and for the RE_T_EU data, meaning that the process is stationary, evolving towards the fixed point RE_T_EU = 16.10. For the RE_T_RO data, we obtain the roots 0.999 and 0.220, situated inside the unit cycle. As one of the roots is close to one, the convergence is very slow.
Finally, using the share of renewable energy in the final energy consumption in the heating and cooling sector for the European Union (RE_H&C_EU) and Romania (RE_H&C_RO) as a dependent variable, the empirical estimations of Equations (1)–(4) led to the results reported in Table 6.
In these cases, the estimated coefficients for the first three models are statistically significant at a 1% significance level, for the RE_H&C_EU data, while for the Romania data, only the first two models satisfy this property, while the third has a level of significance of 5%.
In Figure A3, the estimated regression line and parabola for the RE_H&C variable are plotted. The linear estimations show an increasing trend for both the EU and Romania data, with a similar annual growth rate of 0.682 and 0.6, respectively, being 12% bigger for the EU. The quadratic estimations show a non-convex trend, with the turning point located at about 2024 for the EU data and at 2014 for the Romania data.
The estimation of the autoregressive Equation (3) has the roots and , respectively, showing stationarity towards the values RE_H&C_EU and RE_H&C_RO , respectively.
For model (4), the roots of the characteristic equation are 0.925 and –0.515 for the RE_H&C_EU data, and for the RO_EU data, with all of them being situated inside the unit cycle. Hence, both the dynamical equations evolve towards stationary points, namely, RE_H&C_EU and RE_H&C_RO , respectively.
To compare the quality of the fit of the four models for the analyzed data, we use several regression coefficients, computed by EViews, given in Table 7.
Comparing the values for RE_EU in Table 7, we may conclude that the quadratic model provides a better fit than the linear model, while model (3) is slightly better than model (4). Similar computations are conducted for the shares of renewable energy consumption in the considered three sectors of the final energy consumption.
For the variable RE_E_EU, the values of the regression coefficients lead to the conclusion that models (1) and (2) offer almost similar estimations, while model (4) seems to give the best estimation for RE_E_RO.
The quadratic model seems to provide a better estimation than the linear one, for the variable RE_H&C, for both sets of data, while the autoregressive models and the regression coefficients, given in Table 7, are comparable.
Finally, models (1) and (2) offer almost similar estimations for variable RE_T_EU, being better than the autoregressive models in terms of the regression statistical coefficients, while for RE_T_RO, these coefficients have comparable values for all the models.
As a general remark, for all the polynomial models, the probabilities attached to the t-statistical test are lower than the significance level of 5% for most of the regression coefficients, thus the estimated coefficients are statistically significant. The autoregressive models have low probability values for the estimated coefficients, and, therefore, it is accepted that, generally, these models are valid.
The determination ratio R2 has values around 90% (with two exceptions for RE_H&C_RO), confirming the validity of the models.
In Table 8, the results of several statistic tests, performed in order to establish the reliability of the autoregressive models, are reported.
From Table 8, it follows that for all the models, the mean value of the residual variable tends to accelerate to zero. The models pass the error autocorrelation tests, according to Durbin–Watson statistic (DW around two), thus there is a positive serial correlation in all the models.
The values of the Jarque–Berra test confirm the normal distribution of the residual variable values. Next, applying the White test to test the homoskedasticity of the model, the results in Table 8 show that the random errors are homoskedastic, as the probability attached to the F-statistic is higher than 5%. In conclusion, the chosen models pass the error autocorrelation tests.
In conclusion, apart from the three exceptions indicated in Table 8, the autoregressive models are valid for the analyzed data.
5.2. Forecasting the Share of Renewable Energy Consumption by Sectors and Overall in Final Energy Consumption
We use the regression models (1)–(4) to predict the evolution of the share of renewable energy consumption by sectors, and, overall, in the final energy consumption for the 2030 horizon.
Using the empirical estimated equations for the share of renewable energy in the final energy consumption, with the estimated coefficients given in Table 3, we obtain the predicted values presented in Table 9.
In Figure 8 below, we represented the actual RE series for the period 2004–2019, the linear and quadratic regression curves, and the curves corresponding to the autoregressive estimated models for 2020–2030, for both the EU and Romania.
We may conclude that the predicted values of the share of renewable energy in the final energy consumption obtained by the considered models (1)–(4) are very far from the EU expected target of 30%. None of the four evolution scenarios for the share of renewable energy in the final energy consumption at the EU level allow the 30% target to be achieved by 2030. The closest scenario is the linear one, so, in order to reach the set target, the mean annual growth rate of RE_EU should be greater than 0.7. At the Romania level, maintaining the linear scenario, with a mean annual growth rate of RE_RO at about 0.56, should lead to the achievement of the goal. In the other three scenarios, the evolution is far from the desired goal.
For the share of renewable energy in electricity consumption and the empirical estimated equations, with the coefficients given in Table 4, we obtain the predicted values in Table 10.
The target set by the EU Directive [3], for the share of renewable energy consumption in the final energy consumption in the electricity sector, is to reach 50% by 2030. At the EU level, all four evolution scenarios for the share of renewable energy consumption in electricity prefigures values close to the desired one. Thus, maintaining an annual growth rate for RE_E_EU of 1.3 should achieve the target. For Romania, the four scenarios of evolution are quite different. Nevertheless, following a scenario close to the linear one, with a mean annual growth rate of about 1.2, should lead to the target being overpassed.
In Figure 9 below, we represented the actual RE_E series for the period 2004–2019, the linear and quadratic regression curves, and the curves corresponding to the autoregressive estimated models for 2020–2030, for both the EU and Romania.
Next, for the share of renewable energy in the final energy consumption in the transport sector, the empirical estimated equations, with the coefficients given in Table 5, the predicted values in Table 11 are obtained.
In Figure 10 below, we represented the actual RE_T series for the period 2004–2019, the linear and quadratic regression curves, and the curves corresponding to the autoregressive estimated models for 2020–2030, for both the EU and Romania.
For the share of renewable energy consumption in the final energy consumption in the transport sector, the target set by the EU Directive [3] is to reach 14% by 2030. At the EU level, following the linear scenario, maintaining an annual growth rate for RE_T_EU of about 0.45 should lead close to the desired value. The other four evolution scenarios for the share of renewable energy consumption in the final energy consumption in the transport sector should lead to values between 11 and 12%.
For Romania, the linear and autoregressive model scenarios are closer to the target. Thus, an annual growth rate for RE_T_EU of at least 0.45 is necessary, in order to reach the 14% goal.
Finally, for the share of renewable energy in the final energy consumption in the heating and cooling sector, the empirical estimated equations, with the coefficients given in Table 6, the predicted values are displayed in Table 12.
In Figure 11 below, we represented the RE_H&C series for the period 2004–2019, the linear and quadratic regression curves, and the curves corresponding to the autoregressive estimated models for 2020–2030, for both the EU and Romania.
The target set for the share of renewable energy consumption in the final energy consumption in the heating and cooling sector is 32% by 2030. At the EU level, all four evolution scenarios for the share of renewable energy consumption in the final energy consumption in the electricity sector are below this value, with the closer one being the linear scenario again. Thus, maintaining an annual growth rate for RE_H&C_EU that is above 0.68 should allow the target to be reached. For Romania, the four scenarios of evolution are quite different. As in the transport case, following a scenario close to the linear one, with a mean annual growth rate of about 0.6, should lead to the target being overpassed.
The results of the forecasts obtained from the estimates models are for all the indicators at the EU level, below those established as targets by the EU. Compared to the values prefigured in [68], the results forecasted by the models estimated in our paper are way below.
For all the indicators, both at the EU and Romania level, maintaining an annual growth rate close to the one given by the linear scenario should lead to the targets set in EU Directive being achieved.
We may conclude that hypothesis H1 is partially validated.
6. Empiric Estimation of the Multilinear Regression Model
In this section, we aim to prove if hypothesis H2 is valid.
The analysis of model (7) involves firstly investigating the stationarity of the variables and establishing the order of integration of the variables. Then, we will study the long-term causal relationships and the direction of causality between the variables, using cointegration tests, error correction models, and Granger causality tests.
Using the Dickey–Fuller test, the stationarity of the data series, the individual effects option, and the automatic lag selection are verified, and the results of the LLC unit root test, performed on each indicator, show that the null hypothesis of a common unit root cannot be rejected, with these processes being largely non-stationary (Table 13).
The degree of correlation between the variables is analyzed, and it is found that it is very high (close to one) (Table 14).
Johansen [70] showed that a linear combination of two or more non-stationary time series can be a stationary series. If there is a linear combination, it can be said that the non-stationary component series are cointegrated. The stationary linear combination (cointegration equation) is interpreted as a long-term equilibrium relationship between the variables. In order to determine whether the non-stationary series are cointegrated or not, the Johansen cointegration test was applied (Table 15).
The test hypotheses are as follows:
Hypothesis 0 (H0).
Variables are not cointegrated.
Hypothesis 1 (H1).
Variables are cointegrated.
The variable cointegration testing for each cross section with the Johansen test indicates the existence of a cointegration relationship between the variables, at the significance level of 0.05% (prob. ** < 0.05; the null hypothesis is rejected and the H1 hypothesis is accepted, so the series are cointegrated). In conclusion, the analyzed indicators, both for the EU-27 and for Romania, are integrated by cointegration equations, resulting in stationary series.
The existence of long-term equilibrium relations between the variables implies that between the studied variables, there is a Granger causality in at least one direction. In Table 16, we present the results of the Granger causality test, between all the pairs formed by the four variables, using an option with two lags.
At the EU-27 level, there is no Granger causality between the pairs of indicators (with one exception). The causal relationship between the groups of indicators shows that the null hypotheses will be accepted, as the errors assumed by rejecting the null hypothesis are very large.
The null hypotheses of Granger causality are accepted in Romania for most pairs of indicators, which means that there is no causality in any sense. There is one-way Granger causality between RE and RE_T, and RE_E and RE_T, according to the test results, namely, RE_T caused Granger causality by RE and RE_E, but not vice versa.
We continue with the verification of the validity of the model (cointegration equation), by applying the White test to observe whether the random errors are homoscedastic or not. The test applies to the following hypotheses (Table 17):
Hypothesis 0 (H0).
There is homoskedasticity.
Hypothesis 1 (H1).
There is heteroskedasticity.
As the prob. is greater than 0.05, hypothesis H0 is accepted and H1 is rejected, meaning that there is homoscedasticity between the variables, and thus the chosen model is valid, and the variance of the model, in relation to the explanatory variables, remains constant.
The F-statistic values proposed for the EU and RO are F = 4014.8 and 1158.6, respectively, with a probability of zero; therefore, it is accepted that the overall multiple linear regression model is valid (Table 18). The model passes the error autocorrelation tests, according to the Durbin–Watson value (DW = 1.7).
The determination ratio of almost one (R2 over 99%) shows the percentage by which the influence of significant factors is explained (Table 18). Respectively, over 99% of the variation in RE is explained by the variation in the variables RE_E, RE_H&C, and RE_T.
The equation analysis is as follows (Table 19):
- At a 1% increase in RE_E, RE at the EU-27 level increases by 0.155778%, and by 0.188085% at the Romania level, given that the other variables remain constant;
- At a 1% increase in RE_T, RE increases at the EU-27 level by 0.13577%, and by 0.03255% at the Romania level, given that the other variables remain constant;
- At a 1% increase in RE_H&C, RE increases at the EU-27 level by 0.620493%, and by 0.543352% at the Romanian level, given that the other variables remain constant.
Therefore, a positive evolution of the three variables contributes to the increase in the share of renewable energy consumption in the final energy consumption, with the largest contribution being made by the heating and cooling sector. The same conclusion emerged from the analysis of Granger causality, which has the largest share of energy consumption in the final energy consumption in the H&C sector.
The results of the empirical estimations also led to the conclusion that not all the sectors of final energy consumption have an equal contribution to the share of renewable energy consumption in the final energy consumption, with the contribution of the heating and cooling sector being significantly bigger. Thus, hypothesis H2 is not true.
7. Discussions and Conclusions
This work is motivated by the European Directive [3], which states the necessity to increase the consumption of renewable energy, such that its share in the final energy consumption in EU countries will reach the target of 32% by 2030. In this sense, we analyzed the evolution, and then the medium- and long-term trend of the share of renewable energy consumption in the final energy consumption, both at the general level and on the main components, at the level of the European Union and Romania. This is a novelty in the field, because most authors have only focused their studies on a certain sector, or in general.
The study was developed in the following four directions: (1) comparative analysis of the evolution of the indicators for the period 2004–2019 for Romania and the EU; (2) empirical estimation of the evolution of the indicators, using time regression and autoregressive models; (3) forecasting the share of renewable energy consumption in the final energy consumption, and by main sectors; and (4) empirical analysis of the interdependence between the indicators.
The comparative analysis of the evolution of the indicators in the analyzed period, both globally and for the three considered sectors, showed that the share of renewable energy consumption in the final energy consumption in Romania is higher than in the EU-27 (except for the transport sector).
The share of renewable energy consumption in the final energy consumption at the EU-27 level shows a permanent increase globally, unlike Romania, where the trend of the global share of renewable energy consumption in the final energy consumption, in recent years, has been steadily decreasing, but has remained above the EU-27 trend.
Regarding the consumption of renewable energy by sectors, the trend is increasing in all sectors, both at the EU-27 and Romania level, but it varies significantly by sector.
Overall, the shares of renewable energy in the final energy consumption in the electricity sector, as well as the heating and cooling sectors, have been above the indicative trajectories for achieving the targets set by the EU.
The four estimated models provide possible evolution scenarios for the considered indicators. We found that maintaining annual growth rates close to those provided by the linear model, for each of the indicators, would lead to values close to those desired for the 2030 horizon, validating hypothesis H1. Thus, the following points apply:
- For the RE indicator, the hypothesis is not verified for any of the scenarios proposed at the EU level; to reach the target, an annual increase of more than 0.7 should be necessary. For Romania, the hypothesis is only verified according to the first scenario; thus, maintaining an annual increase of approximately 0.57 should lead to the desired value;
- For RE_E, the hypothesis is verified for all the proposed scenarios, for both the EU and Romania;
- In what concerns the RE_T indicator for the EU, the hypothesis is only verified by the first scenarios, according to which an annual increase of at least 0.45 should be necessary, while for Romania, H1 is not valid for all the analyzed scenarios;
- Finally, for the RE_H&C indicator, hypothesis H1 is validated by the first scenario, both for the EU and Romania, by maintaining annual increases of at least 0.68 and 0.6, respectively.
Demonstrating the existence of long-term equilibrium relationships between RE and other indicators involved several stages of statistical analysis and computation. The results of the empirical estimations led to the conclusion that a positive evolution of RE_E, RE_T, and RE_H&C contributes to the increase in the share of renewable energy consumption in the final energy consumption. The extent to which the renewable energy consumption of each sector contributes to the share of renewable energy consumption in the final energy consumption is also determined, finding that the largest contribution is from renewable energy consumption in the H&C sector, invalidating hypothesis H2.
Renewable energy consumption is of major importance for the European Union, because environmental policies aim to achieve a cleaner environment, a better future for community members, as well as increasing independence and energy security.
In response to legislative and regulatory pressures to increase the consumption of renewable resources, as an alternative to traditional fuels, similarly to other European countries, Romania has already begun to change its energy business models.
According to the results of the forecasts made for the analyzed indicators, we found that both the EU and Romania could reach the percentages set in the EU Directive for 2030, provided that they make a sustained effort and adopt efficient energy policies, stimulating the consumption of renewable energy in all the sectors, but especially in the H&C and transport sectors. In this sense, the results of this study support the motivation to establish measures by Romanian decision makers, in order to achieve the set objectives [66].
Unfortunately, we did not find studies regarding the analysis of the share of renewable energy consumption by sectors in EU countries, to compare to the results obtained in our research.
As a result of the research being conducted in this study, we may conclude that the models estimated based on the available data (2004–2019) led to forecasts that might constitute possible scenarios to follow, in order to achieve the targets set by EU Directives, both for the EU and the EU countries.
These results may also constitute premises for conducting studies in this field.
We intend to improve the scenarios presented in this study in subsequent work, and eventually to design others that can provide better accuracy to the forecasts.
Author Contributions
A.M., G.S., M.S., and E.G. equally contributed to this research. All authors have read and agreed to the published version of the manuscript.
Funding
For authors Mihaela STERPU and Eugenia GRECU: This research was partially supported by Horizon2020-2017-RISE-777911 project.
Institutional Review Board Statement
Not applicable.
Informed Consent Statement
Not applicable.
Data Availability Statement
The time series for the indicators was extracted from the following Eurostat website: https://ec.europa.eu/eurostat/databrowser/view/sdg_07_40/default/table?lang=en (accessed on 26 May 2021) [68].
Acknowledgments
The authors acknowledge the anonymous reviewers whose suggestions and comments helped improving the paper.
Conflicts of Interest
The authors declare no conflict of interest.
Appendix A
Figure A1.
Estimation of renewable energy consumption share in final energy consumption in the electricity sector by the linear and quadratic regression method, for EU and Romania data.
Figure A1.
Estimation of renewable energy consumption share in final energy consumption in the electricity sector by the linear and quadratic regression method, for EU and Romania data.

Figure A2.
Estimation of renewable energy consumption share in final energy consumption in the transport sector by the linear and quadratic regression method, for EU and Romania data.
Figure A2.
Estimation of renewable energy consumption share in final energy consumption in the transport sector by the linear and quadratic regression method, for EU and Romania data.

Figure A3.
Estimation of renewable energy consumption share in final energy consumption in the heating and cooling sector by the linear and quadratic regression method, for EU and Romania data.
Figure A3.
Estimation of renewable energy consumption share in final energy consumption in the heating and cooling sector by the linear and quadratic regression method, for EU and Romania data.

References
- European Environment Agency. Directive 2009/28/EC of the European Parliament and of the Council of 23 April 2009 on the Promotion of the Use of Energy from Renewable Sources and Amending and Subsequently Repealing Directives 2001/77/EC and 2003/30/EC. Available online: https://www.eea.europa.eu/policy-documents/2009-28-ec (accessed on 28 April 2021).
- Eurostat. Renewable Energy in the EU in 2018. Available online: https://ec.europa.eu/eurostat/documents/2995521/10335438/8-23012020-AP-EN.pdf/292cf2e5-8870-4525-7ad7-188864ba0c2 (accessed on 25 April 2021).
- European Environment Agency. Directive (EU) 2018/2001 of the European Parliament and of the Council of 11 December 2018 on the Promotion of the Use of Energy from Renewable Sources. Available online: https://eur-lex.europa.eu/legal-content/EN/TXT/?uri=uriserv:OJ.L_.2018.328.01.0082.01.ENG (accessed on 3 May 2021).
- European Commission. Communication from the Commission to the European Parliament, the European Council, the Council, the European Economic and Social Committee and the Committee of the Regions the European Green Deal, COM/2019/640 final. Available online: https://eur-lex.europa.eu/legal-content/EN/ALL/?uri=CELEX%3A52019DC0640 (accessed on 3 May 2021).
- European Commission. Climate Strategies and Targets, 2050 Long-Term Strategy. Available online: https://ec.europa.eu/clima/policies/strategies/2050_en (accessed on 4 May 2021).
- Roussafi, F. Regional development trajectories of renewable energy: Evidence from French regions. Energy Strat. Rev. 2021, 35, 100639. [Google Scholar] [CrossRef]
- Xu, X.; Wei, Z.; Ji, Q.; Wang, C.; Gao, G. Global renewable energy development: Influencing factors, trend predictions and countermeasures. Resour. Policy 2019, 63. [Google Scholar] [CrossRef]
- Sharvini, S.R.; Noor, Z.Z.; Chong, C.S.; Stringer, L.C.; Yusuf, R.O. Energy consumption trends and their linkages with renewable energy policies in East and Southeast Asian countries: Challenges and opportunities. Sustain. Environ. Res. 2018, 28, 257–266. [Google Scholar] [CrossRef]
- Wang, Z.; Danish, K.; Zhang, B.; Wang, B. Renewable energy consumption, economic growth and human development index in Pakistan: Evidence form simultaneous equation model. J. Clean. Prod. 2018, 184, 1081–1090. [Google Scholar] [CrossRef]
- Wang, Q.; Yang, X. Investigating the sustainability of renewable energy—An empirical analysis of European Union countries using a hybrid of projection pursuit fuzzy clustering model and accelerated genetic algorithm based on real coding. J. Clean. Prod. 2020, 268, 121940. [Google Scholar] [CrossRef]
- Asiedu, B.A.; Hassan, A.A.; Bein, M.A. Renewable energy, non-renewable energy, and economic growth: Evidence from 26 European countries. Environ. Sci. Pollut. Res. 2020, 28, 11119–11128. [Google Scholar] [CrossRef]
- AhAtil, A.; Bouheni, F.B.; Lahiani, A.; Shahbaz, M. Factors Influencing CO2 Emission in China: A Nonlinear Autoregressive Distributed Lags Investigation. MPRA 2019, 91190. Available online: https://mpra.ub.uni-muenchen.de/91190 (accessed on 4 May 2021).
- Akadiri, S.S.; Alola, A.A.; Akadiri, A.C.; Alola, U.V. Renewable energy consumption in EU-28 countries: Policy toward pollution mitigation and economic sustainability. Energy Policy 2019, 132, 803–810. [Google Scholar] [CrossRef]
- Busu, M. Analyzing the impact of the renewable energy sources on economic growth at the EU level using an ARDL Model. Mathematics 2020, 8, 1367. [Google Scholar] [CrossRef]
- Simionescu, M.; Păuna, C.B.; Diaconescu, T. Renewable energy and economic performance in the context of the European Green Deal. Energies 2020, 13, 6440. [Google Scholar] [CrossRef]
- Dinç, D.T.; Akdoğan, E.C. Renewable energy production, energy consumption and sustainable economic growth in Turkey: A VECM approach. Sustainability 2019, 11, 1273. [Google Scholar] [CrossRef] [Green Version]
- Mutani, G.; Todeschi, V. An urban energy atlas and engineering model for resilient cities. Int. J. Heat Technol. 2019, 37, 936–947. [Google Scholar] [CrossRef] [Green Version]
- Marra, A.; Colantonio, E. The path to renewable energy consumption in the European Union through drivers and barriers: A panel vector autoregressive approach. Socio-Econ. Plan. Sci. 2020, 76, 100958. [Google Scholar] [CrossRef]
- Amoah, A.; Kwablah, E.; Korle, K.; Offei, D. Renewable energy consumption in Africa: The role of economic well-being and economic freedom. Energy Sustain. Soc. 2020, 10, 1–17. [Google Scholar] [CrossRef]
- Ergun, S.J.; Owusu, P.A.; Rivas, M.F. Determinants of renewable energy consumption in Africa. Environ. Sci. Pollut. Res. 2019, 26, 15390–15405. [Google Scholar] [CrossRef] [PubMed]
- Da Silva, P.P.; Cerqueira, P.A.; Ogbe, W. Determinants of renewable energy growth in Sub-Saharan Africa: Evidence from panel ARDL. Energy 2018, 156, 45–54. [Google Scholar] [CrossRef]
- Baye, R.S.; Olper, A.; Ahenkan, A.; Musah-Surugu, I.J.; Anuga, S.W.; Darkwah, S. Renewable energy consumption in Africa: Evidence from a bias corrected dynamic panel. Sci. Total. Environ. 2020, 766, 142583. [Google Scholar] [CrossRef]
- Kwakwa, P.A. What determines renewable energy consumption? Startling evidence from Ghana. Int. J. Energy Sect. Manag. 2020, 15, 101–118. [Google Scholar] [CrossRef]
- Wang, J.; Zhang, S.; Zhang, Q. The relationship of renewable energy consumption to financial development and economic growth in China. Renew. Energy 2021, 170, 897–904. [Google Scholar] [CrossRef]
- Zaharia, A.; Diaconeasa, M.C.; Brad, L.; Ladaru, R.; Ioanăș, C. Factors influencing energy consumption in the context of sustainable development. Sustainability 2019, 11, 4147. [Google Scholar] [CrossRef] [Green Version]
- Pérez-Franco, I.; García-García, A.; Maldonado-Briegas, J.J. Energy transition towards a greener and more competitive economy: The Iberian case. Sustainability 2020, 12, 3343. [Google Scholar] [CrossRef] [Green Version]
- Busu, M.; Nedelcu, A.C. Analyzing the renewable energy and CO2 emission levels nexus at an EU level: A panel data regression approach. Processes 2021, 9, 130. [Google Scholar] [CrossRef]
- Aklin, M.; Urpelainen, J. Political competition, path dependence, and the strategy of sustainable energy transitions. Am. J. Political Sci. 2013, 57, 643–658. [Google Scholar] [CrossRef]
- Li, R.; Leung, G.C. The relationship between energy prices, economic growth and renewable energy consumption: Evidence from Europe. Energy Rep. 2021, 7, 1712–1719. [Google Scholar] [CrossRef]
- Paska, J.; Surma, T.; Terlikowski, P.; Zagrajek, K. Electricity generation from renewable energy sources in Poland as a part of commitment to the Polish and EU Energy Policy. Energies 2020, 13, 4261. [Google Scholar] [CrossRef]
- Caruso, G.; Colantonio, E.; Gattone, S.A. Relationships between renewable energy consumption, social factors, and health: A Panel vector auto regression analysis of a cluster of 12 EU countries. Sustainability 2020, 12, 2915. [Google Scholar] [CrossRef] [Green Version]
- Carfora, A.; Pansini, R.; Romano, A.; Scandurra, G. Renewable energy development and green public policies complementarities: The case of developed and developing countries. Renew. Energy 2018, 115, 741–749. [Google Scholar] [CrossRef]
- Xu, A.T.; Gao, B.W.; Li, C.Y.; Qian, D.F. Impact of the COVID-19 pandemic on the reduction of electricity demand and the integration of renewable energy into the power grid. J. Renew. Sustain. Energy 2021, 13, 026304. [Google Scholar] [CrossRef]
- Strielkowski, W.; Firsova, I.; Lukashenko, I.; Raudeliūnienė, J.; Tvaronavičienė, M. Effective management of energy consumption during the COVID-19 pandemic: The role of ICT solutions. Energies 2021, 14, 893. [Google Scholar] [CrossRef]
- Ike, G.N.; Usman, O.; Alola, A.; Sarkodie, S.A. Environmental quality effects of income, energy prices and trade: The role of renewable energy consumption in G-7 countries. Sci. Total. Environ. 2020, 721, 137813. [Google Scholar] [CrossRef]
- Hao, F.; Shao, W. What really drives the deployment of renewable energy? A global assessment of 118 countries. Energy Res. Soc. Sci. 2020, 72, 101880. [Google Scholar] [CrossRef]
- Dong, F.; Pan, Y. Evolution of renewable energy in BRI countries: A combined econometric and decomposition approach. Int. J. Environ. Res. Public Health 2020, 17, 8668. [Google Scholar] [CrossRef]
- Murshed, M. Are trade liberalization policies aligned with renewable energy transition in low and middle income countries? An instrumental variable approach. Renew. Energy 2019, 151, 1110–1123. [Google Scholar] [CrossRef]
- Chovancová, J.; Vavrek, R. (De)coupling analysis with focus on energy consumption in EU countries and its spatial evaluation. Pol. J. Environ. Stud. 2020, 29, 2091–2100. [Google Scholar] [CrossRef]
- Meyer, N.; Magda, R.; Bozsik, N. The role of renewable energies in the new EU member states. J. East. Eur. Central Asian Res. 2021, 8, 18–25. [Google Scholar] [CrossRef]
- IEA. Renewables Information: Overview. Comprehensive Historical Review and Current Market Trends in Renewable Energy. Statistics Report—July 2020. Available online: https://www.iea.org/reports/renewables-information-overview (accessed on 21 May 2021).
- Włodarczyk, B.; Firoiu, D.; Ionescu, G.; Ghiocel, F.; Szturo, M.; Markowski, L. Assessing the sustainable development and renewable energy sources relationship in EU countries. Energies 2021, 14, 2323. [Google Scholar] [CrossRef]
- Gaigalis, V.; Katinas, V. Analysis of the renewable energy implementation and prediction prospects in compliance with the EU policy: A case of Lithuania. Renew. Energy 2019, 151, 1016–1027. [Google Scholar] [CrossRef]
- Papież, M.; Śmiech, S.; Frodyma, K. Effects of renewable energy sector development on electricity consumption—Growth nexus in the European Union. Renew. Sustain. Energy Rev. 2019, 113. [Google Scholar] [CrossRef]
- Ember and Agora Energiewende. Ember—Europe’s Power Sector in 2020. Available online: https://ember-climate.org/project/eu-power-sector-2020/#:~:text=Ember%20and%20Agora%20Energiewende%E2%80%99s%20fifth%20annual%20report%20tracking,of%20electricity%20for%20the%20first%20time%20in%202020 (accessed on 7 May 2021).
- Bellocchi, S.; Manno, M.; Noussan, M.; Prina, M.G.; Vellini, M. Electrification of transport and residential heating sectors in support of renewable penetration: Scenarios for the Italian energy system. Energy 2020, 196, 117062. [Google Scholar] [CrossRef]
- Eurostat. Renewable Energy for Heating and Cooling. Available online: https://ec.europa.eu/eurostat/web/products-eurostat-news/-/DDN-20200211-1 (accessed on 14 May 2021).
- Eicker, U.; Demir, E.; Gürlich, D. Strategies for cost efficient refurbishment and solar energy integration in European Case Study buildings. Energy Build. 2015, 102, 237–249. [Google Scholar] [CrossRef]
- EREC (European Renewable Energy Council). Mapping Renewable Energy Pathways towards 2020. EU ROADMAP. Available online: http://www.eufores.org/fileadmin/eufores/Projects/REPAP_2020/EREC-roadmap-V4.pdf (accessed on 12 May 2021).
- Siksnelyte-Butkiene, I.; Streimikiene, D.; Balezentis, T. Multi-criteria analysis of heating sector sustainability in selected North European countries. Sustain. Cities Soc. 2021, 69, 102826. [Google Scholar] [CrossRef]
- Bertelsen, N.; Mathiesen, B.V. EU-28 residential heat supply and consumption: Historical development and status. Energies 2020, 13, 1894. [Google Scholar] [CrossRef]
- Canale, L.; Di Fazio, A.; Russo, M.; Frattolillo, A.; Dell’Isola, M. An overview on functional integration of hybrid renewable energy systems in multi-energy buildings. Energies 2021, 14, 1078. [Google Scholar] [CrossRef]
- Ahmed, M.M.; Shimada, K. The effect of renewable energy consumption on sustainable economic development: Evidence from emerging and developing economies. Energies 2019, 12, 2954. [Google Scholar] [CrossRef] [Green Version]
- Nematchoua, M.K.; Yvon, A.; Roy, S.E.J.; Ralijaona, C.G.; Mamiharijaona, R.; Razafinjaka, J.N.; Tefy, R. A review on energy consumption in the residential and commercial buildings located in tropical regions of Indian Ocean: A case of Madagascar island. J. Energy Storage 2019, 24, 100748. [Google Scholar] [CrossRef]
- Hassan, A.A.; El-Rayes, K. Optimizing the integration of renewable energy in existing buildings. Energy Build. 2021, 238, 110851. [Google Scholar] [CrossRef]
- EPRS. European Parliamentary Research Service—Renewable Energy Directive Revision of Directive (EU) 2018/2001. Available online: https://buildup.eu/en/practices/publications/briefing-renewable-energy-directive-revision-directive-eu-20182001 (accessed on 23 May 2021).
- International Energy Agency. Global Energy Review 2020—The Impacts of the Covid-19 Crisis on Global Energy Demand and CO2 Emissions. Available online: https://www.iea.org/articles/global-energy-review-co2-emissions-in-2020 (accessed on 2 June 2021).
- European Commission. Renewable Energy—Recast to 2030 (RED II). Available online: https://ec.europa.eu/jrc/en/jec/renewable-energy-recast-2030-red-ii (accessed on 2 June 2021).
- Chiaramonti, D.; Talluri, G.; Scarlat, N.; Prussi, M. The challenge of forecasting the role of biofuel in EU transport decarbonisation at 2050: A meta-analysis review of published scenarios. Renew. Sustain. Energy Rev. 2021, 139, 110715. [Google Scholar] [CrossRef]
- IEEE. European Public Policy Committee Position Statement, Heating and Cooling Future of Europe and Interactions with Electricity Adopted 16 January 2018. Available online: https://www.ieee.org/content/dam/ieee-org/ieee/web/org/about/heating_and_cooling_future_of_europe_25_january_2018.pdf (accessed on 4 June 2021).
- Gryparis, E.; Papadopoulos, P.; Leligou, H.C.; Psomopoulos, C.S. Electricity demand and carbon emission in power generation under high penetration of electric vehicles. A European Union perspective. Energy Rep. 2020, 6, 475–486. [Google Scholar] [CrossRef]
- Meisel, K.; Millinger, M.; Naumann, K.; Müller-Langer, F.; Majer, S.; Thrän, D. Future renewable fuel mixes in transport in Germany under RED II and climate protection targets. Energies 2020, 13, 1712. [Google Scholar] [CrossRef] [Green Version]
- Bastida-Molina, P.; Hurtado-Pérez, E.; Peñalvo-López, E.; Gómez, M.C.M. Assessing transport emissions reduction while increasing electric vehicles and renewable generation levels. Transp. Res. D Transp. Environ. 2020, 88, 102560. [Google Scholar] [CrossRef]
- Ram, M.; Bogdanov, D.; Aghahosseini, A.; Gulagi, A.; Oyewo, A.S.; Child, M.; Caldera, U.; Sadovskaia, K.; Farfan, J.; Barbosa, L.S.N.S.; et al. Global Energy System Based on 100% Renewable Energy—Energy Transition in Europe Across Power, Heat, Transport and Desalination Sectors; LUT University: Lappeenranta, Finland; Energy Watch Group: Berlin, Germany, 2018; ISBN 978-952-335-329-9. [Google Scholar]
- García-Olivares, A.; Solé, J.; Samsó, R.; Ballabrera-Poy, J. Sustainable European transport system in a 100% renewable economy. Sustainability 2020, 12, 5091. [Google Scholar] [CrossRef]
- Integrated National Energy and Climate Change Plan 2021–2030—Romania. Available online: https://ec.europa.eu/energy/sites/default/files/documents/romania_draftnecp_en.pdf (accessed on 7 June 2021).
- European Commission. Regulation on the Governance of the Energy Union 2018/1999—National Long-Term Strategies. Available online: https://ec.europa.eu/info/energy-climate-change-environment/implementation-eu-countries/energy-and-climate-governance-and-reporting/national-long-term-strategies_en (accessed on 30 May 2021).
- Eurostat—Database. Available online: https://ec.europa.eu/eurostat/databrowser/view/sdg_07_40/default/table?lang=en (accessed on 26 May 2021).
- Dickey, D.A.; Fuller, W.A. Likelihood ratio statistics for autoregressive time series with a unit root. Econometrica 1981, 49, 1057. [Google Scholar] [CrossRef]
- Johansen, S.; Juselius, K. Maximum likelihood estimation and inference on cointegration—With applications to the demand for money. Oxf. Bull. Econ. Stat. 2009, 52, 169–210. [Google Scholar] [CrossRef]
- Engle, R.F.; Granger, C.W.J. Co-integration and error correction: Representation, estimation, and testing. Econometrica 1987, 55, 251. [Google Scholar] [CrossRef]
- Hayes, A.F.; Cai, L. Using heteroskedasticity-consistent standard error estimators in OLS regression: An introduction and software implementation. Behav. Res. Methods 2007, 39, 709–722. [Google Scholar] [CrossRef] [PubMed] [Green Version]
- Phillips, P.C.B.; Hansen, B.E. Statistical inference in instrumental variables regression with I(1) processes. Rev. Econ. Stud. 1990, 57, 99–125. [Google Scholar] [CrossRef]
Figure 1.
Forecast of the share of renewable energy consumption in total consumption by sectors (processing by [67]).
Figure 1.
Forecast of the share of renewable energy consumption in total consumption by sectors (processing by [67]).

Figure 2.
The evolution of the indicators in the period 2004–2019.

Figure 3.
Evolution of the growth rate of the share of renewable energy consumption in final energy consumption.
Figure 3.
Evolution of the growth rate of the share of renewable energy consumption in final energy consumption.
Figure 4.
Evolution of the growth rate of the share of renewable energy consumption in final energy consumption in the electricity sector.
Figure 4.
Evolution of the growth rate of the share of renewable energy consumption in final energy consumption in the electricity sector.

Figure 5.
Evolution of the growth rate of the share of renewable energy consumption in final energy consumption in the RE_H&C sector.
Figure 5.
Evolution of the growth rate of the share of renewable energy consumption in final energy consumption in the RE_H&C sector.
Figure 6.
Evolution of the growth rate of the share of renewable energy consumption in final energy consumption in the transport sector.
Figure 6.
Evolution of the growth rate of the share of renewable energy consumption in final energy consumption in the transport sector.

Figure 7.
Estimation of renewable energy consumption share in final energy consumption by the linear and quadratic regression method, for EU and Romania data.
Figure 7.
Estimation of renewable energy consumption share in final energy consumption by the linear and quadratic regression method, for EU and Romania data.

Figure 8.
Estimation and prediction of share of RE in final energy consumption for EU and Romania, horizon 2030, using the linear regression (red line), quadratic regression (blue line), autoregressive model of order one (black line), autoregressive model of order two (green line).
Figure 8.
Estimation and prediction of share of RE in final energy consumption for EU and Romania, horizon 2030, using the linear regression (red line), quadratic regression (blue line), autoregressive model of order one (black line), autoregressive model of order two (green line).

Figure 9.
Estimation and prediction of share of RE in electricity consumption sector for EU and Romania, horizon 2030, using the linear regression (red line), quadratic regression (blue line), autoregressive model of order one (black line), autoregressive model of order two (green line).
Figure 9.
Estimation and prediction of share of RE in electricity consumption sector for EU and Romania, horizon 2030, using the linear regression (red line), quadratic regression (blue line), autoregressive model of order one (black line), autoregressive model of order two (green line).

Figure 10.
Estimation and prediction of share of RE in transport sector for EU and Romania, horizon 2030, using the linear regression (red line), quadratic regression (blue line), autoregressive model of order one (black line), autoregressive model of order two (green line).
Figure 10.
Estimation and prediction of share of RE in transport sector for EU and Romania, horizon 2030, using the linear regression (red line), quadratic regression (blue line), autoregressive model of order one (black line), autoregressive model of order two (green line).

Figure 11.
Estimation and prediction of share of RE in transport sector for EU and Romania, horizon 2030, using the linear regression (red line), quadratic regression (blue line), autoregressive model of order one (black line), autoregressive model of order two (green line).
Figure 11.
Estimation and prediction of share of RE in transport sector for EU and Romania, horizon 2030, using the linear regression (red line), quadratic regression (blue line), autoregressive model of order one (black line), autoregressive model of order two (green line).


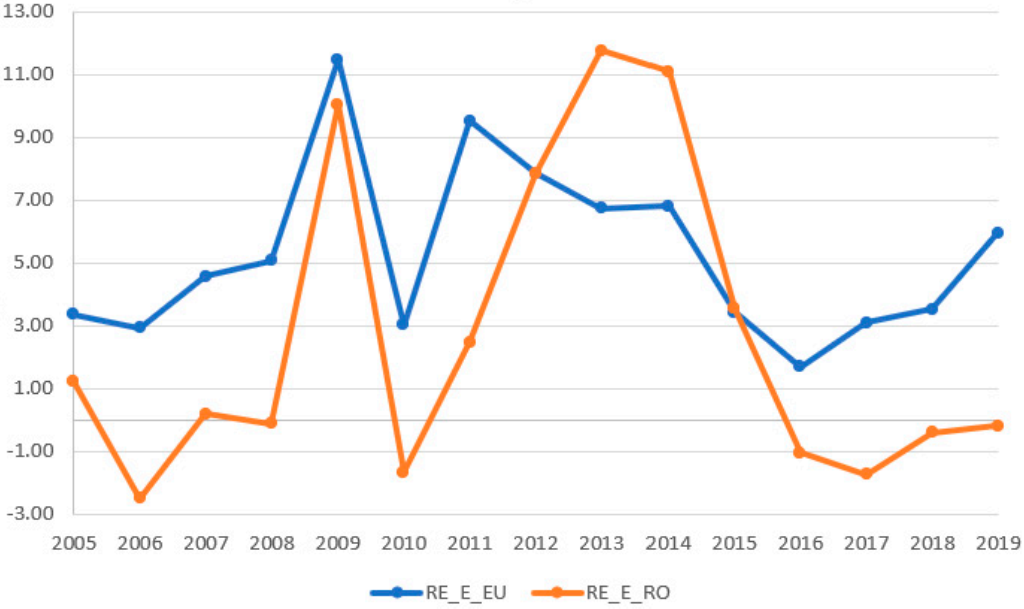
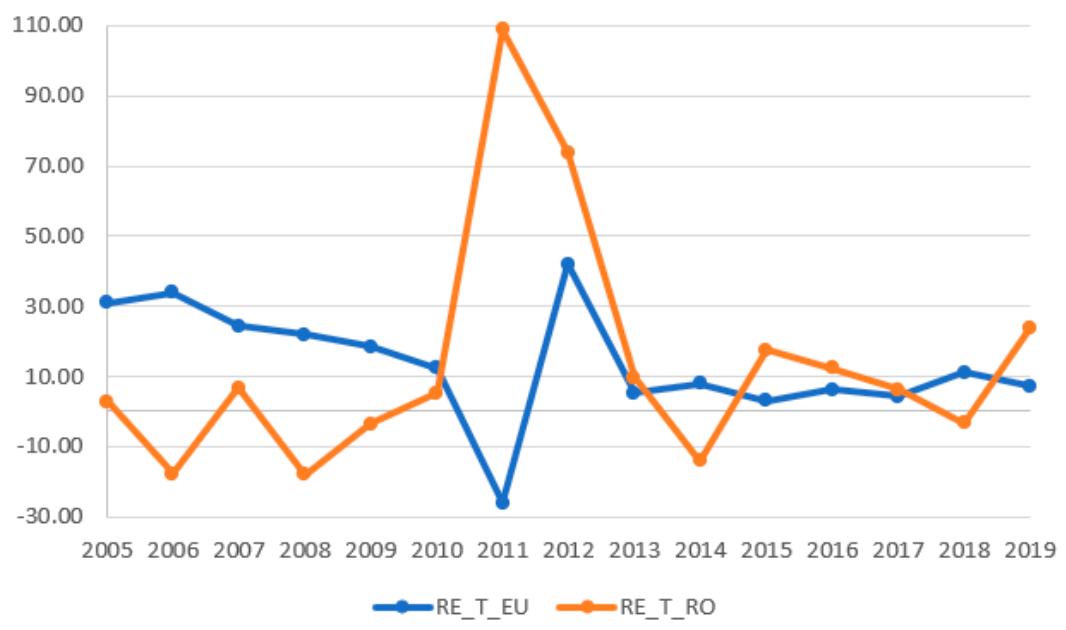
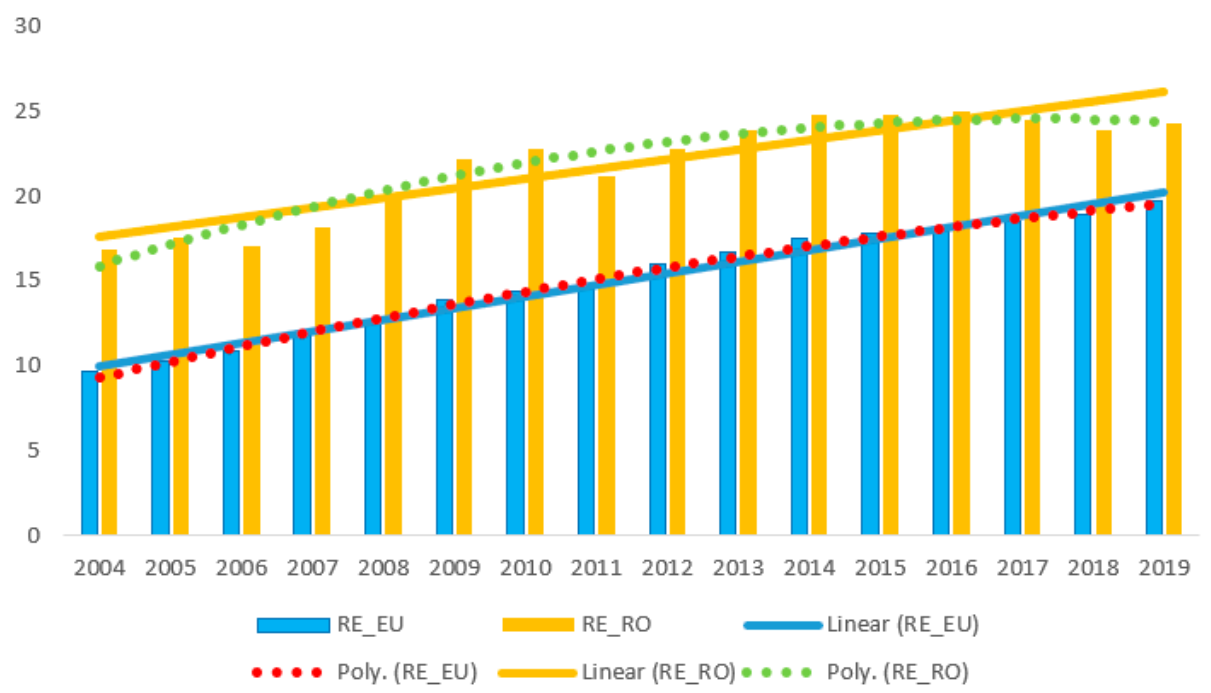
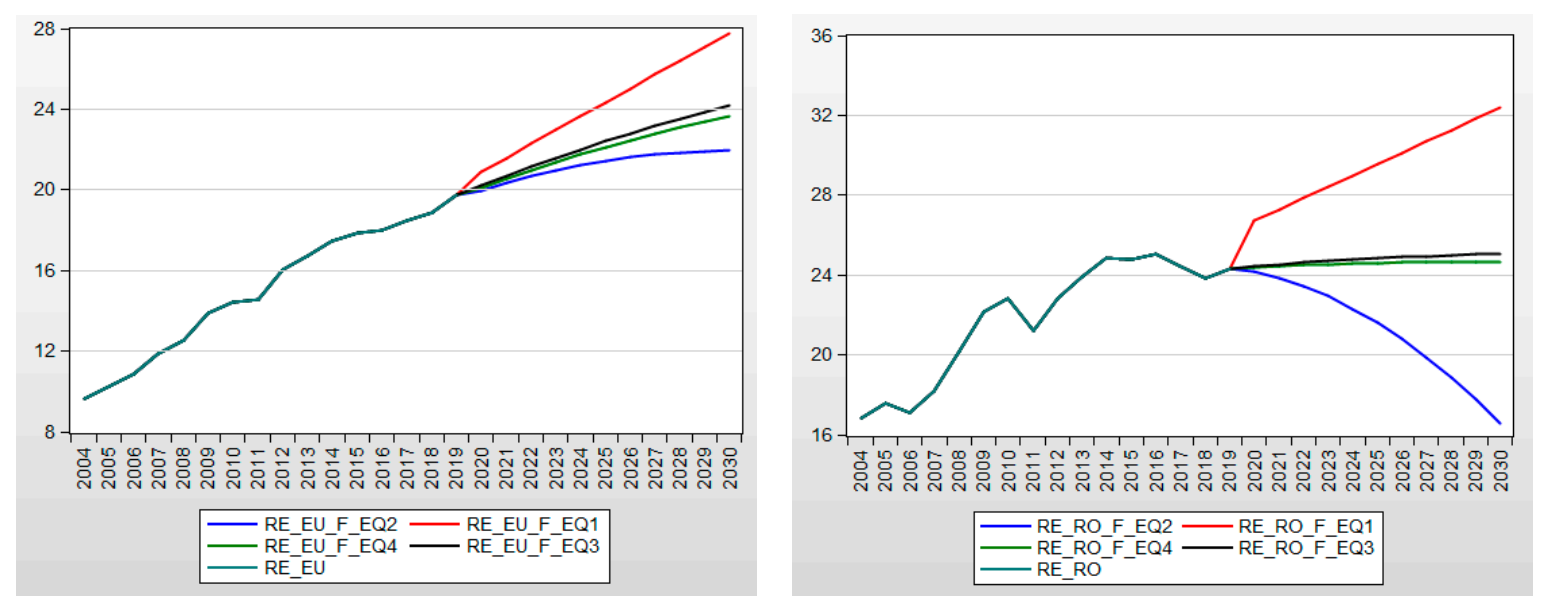
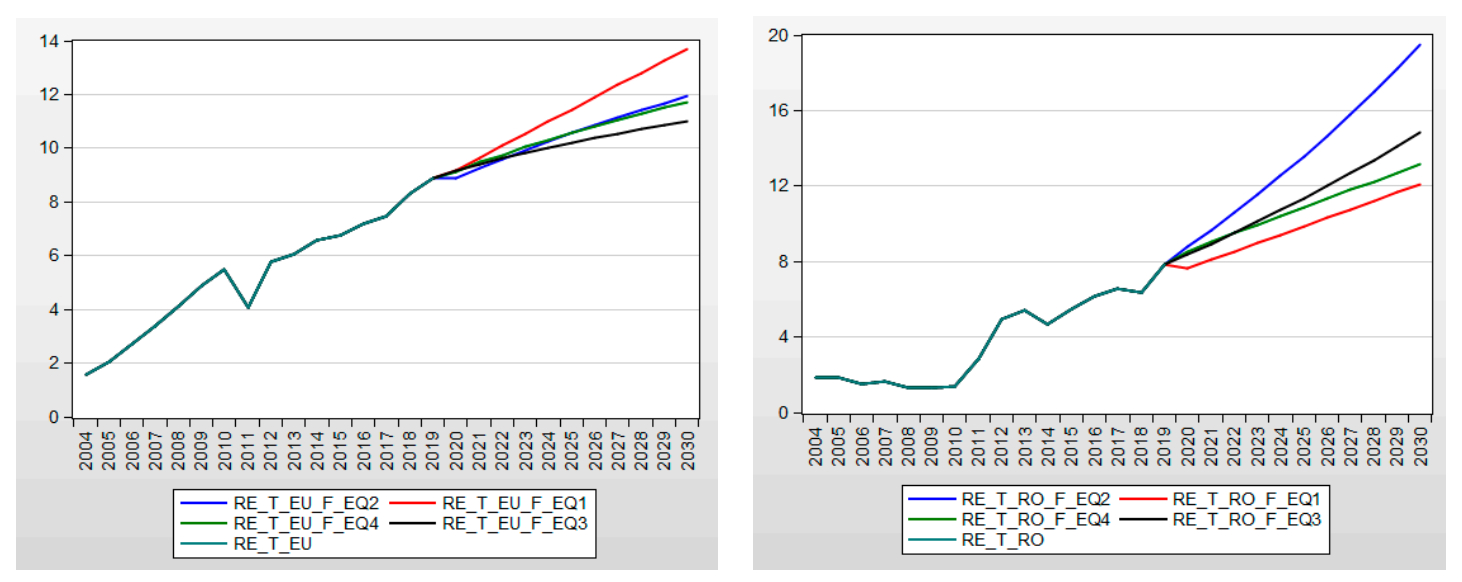
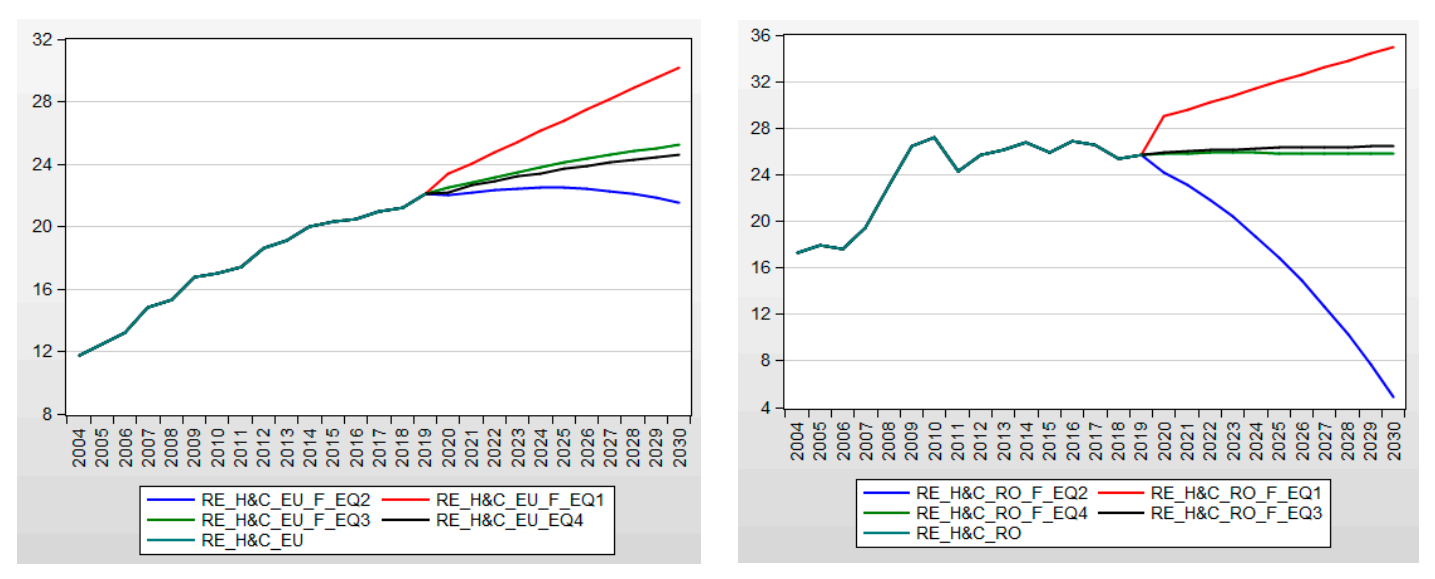
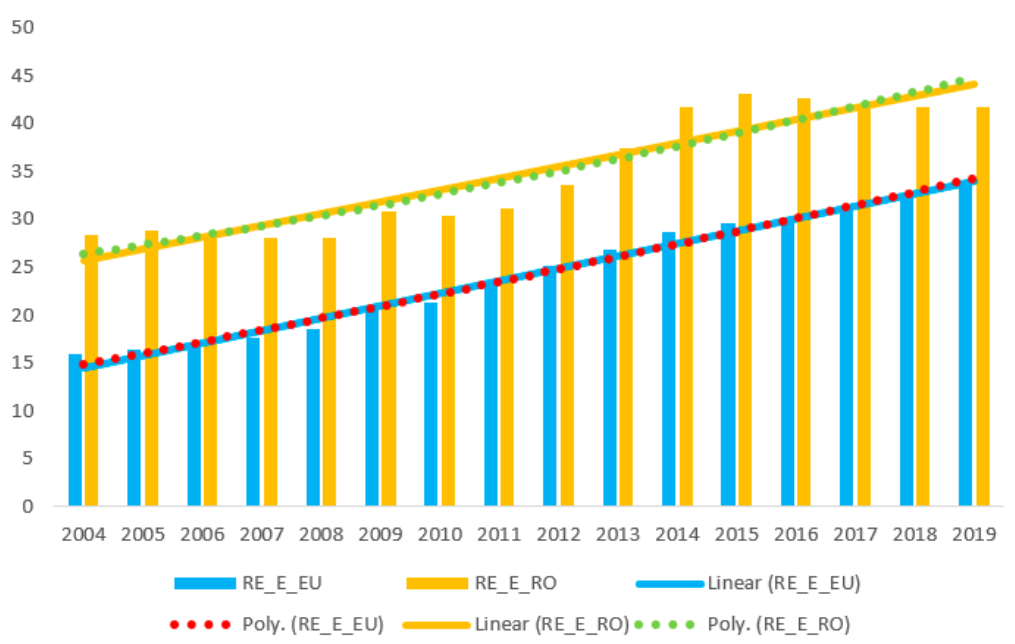
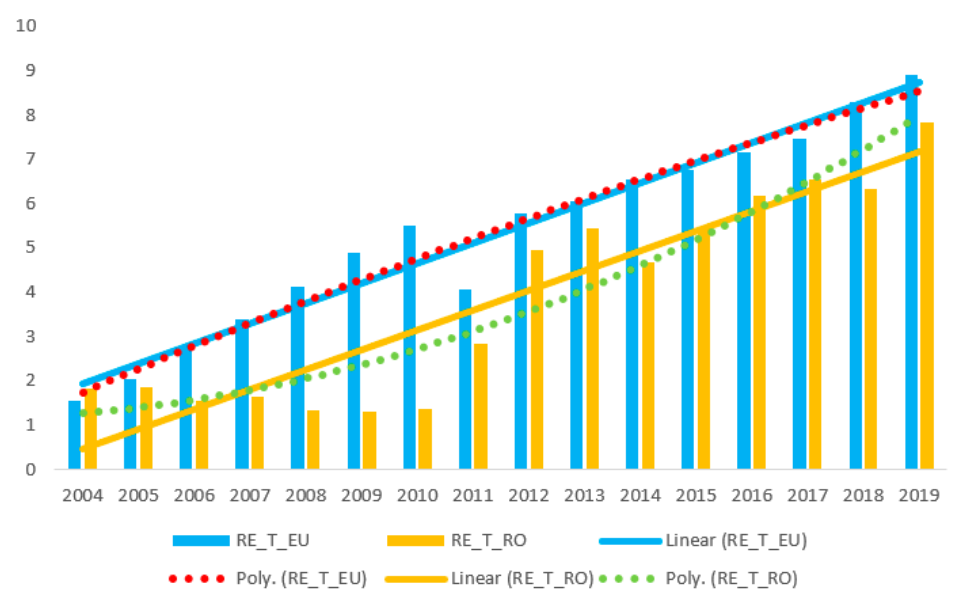
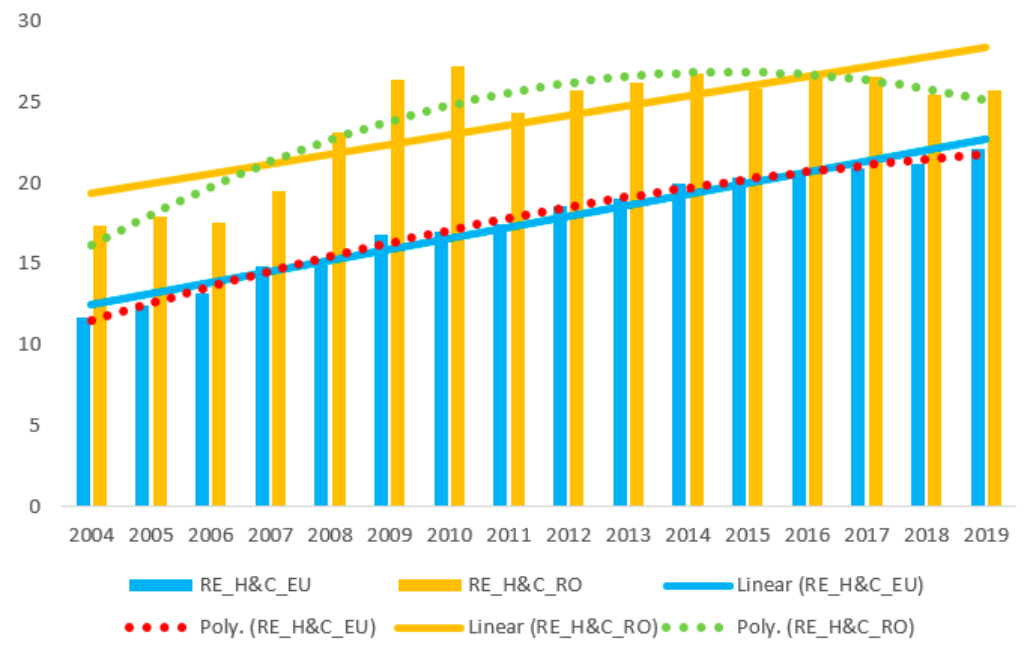
Table 1.
Analysis of the annual growth rate of the indicators analyzed in the period 2004–2019.
| Annual Growth Rate (%) | ||||||||
|---|---|---|---|---|---|---|---|---|
| European Union | Romania | |||||||
| RE | RE_E | RE_H&C | RE_T | RE | RE_E | RE_H&C | RE_T | |
| 2005 | 6.26 | 3.35 | 6.11 | 30.85 | 4.52 | 1.22 | 3.41 | 2.91 |
| 2006 | 5.88 | 2.92 | 6.12 | 33.84 | −2.70 | −2.51 | −1.93 | −17.84 |
| 2007 | 9.50 | 4.56 | 12.18 | 24.37 | 6.43 | 0.19 | 10.71 | 6.70 |
| 2008 | 5.82 | 5.07 | 3.45 | 21.92 | 11.04 | −0.12 | 19.02 | −18.04 |
| 2009 | 10.35 | 11.48 | 9.55 | 18.37 | 9.67 | 10.04 | 14.10 | −3.57 |
| 2010 | 4.06 | 3.02 | 1.36 | 12.45 | 3.06 | −1.67 | 3.00 | 5.32 |
| 2011 | 0.90 | 9.52 | 2.50 | −26.11 | −7.22 | 2.48 | −10.73 | 108.86 |
| 2012 | 10.12 | 7.85 | 6.74 | 41.91 | 7.74 | 7.83 | 5.92 | 73.92 |
| 2013 | 4.20 | 6.75 | 2.49 | 5.27 | 4.65 | 11.77 | 1.75 | 9.73 |
| 2014 | 4.59 | 6.80 | 4.76 | 8.02 | 4.02 | 11.10 | 2.08 | −14.14 |
| 2015 | 2.17 | 3.42 | 1.79 | 3.00 | −0.24 | 3.56 | −3.19 | 17.39 |
| 2016 | 1.05 | 1.69 | 0.82 | 6.20 | 1.00 | −1.04 | 3.78 | 12.41 |
| 2017 | 2.43 | 3.08 | 2.11 | 4.27 | −2.31 | −1.75 | −1.06 | 6.31 |
| 2018 | 2.39 | 3.52 | 1.10 | 11.03 | −2.37 | −0.41 | −4.32 | −3.29 |
| 2019 | 4.34 | 5.96 | 4.34 | 7.18 | 1.74 | −0.20 | 1.20 | 23.72 |
| Growth rate 2019/2004 | 104.81 | 114.92 | 88.40 | 472.04 | 44.49 | 46.72 | 48.46 | 331.34 |
Table 2.
Statistical analysis of indicators.
| Indicators | Mean | Median | Max. | Min. | Std. Dev. | Skewness | Kurtosis | Jarque–Bera | Prob. |
|---|---|---|---|---|---|---|---|---|---|
| RE_EU | 15.07 | 15.288 | 19.729 | 9.633 | 3.299 | −0.264 | 1.733 | 1.257 | 0.534 |
| RE_RO | 21.88 | 22.83 | 25.032 | 16.811 | 2.983 | −0.631 | 1.865 | 1.920 | 0.383 |
| RE_T_EU | 5.33 | 5.634 | 8.901 | 1.556 | 2.203 | −0.163 | 2.011 | 0.723 | 0.697 |
| RE_T_RO | 3.83 | 3.764 | 7.846 | 1.297 | 2.313 | 0.222 | 1.494 | 1.644 | 0.440 |
| RE_E_EU | 24.28 | 24.238 | 34.102 | 15.867 | 6.234 | 0.049 | 1.551 | 1.406 | 0.495 |
| RE_E_RO | 34.87 | 32.349 | 43.161 | 28.054 | 6.31 | 0.206 | 1.258 | 2.135 | 0.344 |
| RE_H&C_EU | 17.60 | 18.032 | 22.097 | 11.729 | 3.302 | −0.419 | 1.925 | 1.238 | 0.538 |
| RE_H&C_RO | 23.91 | 25.742 | 27.227 | 17.337 | 3.641 | −0.979 | 2.255 | 2.926 | 0.232 |
Table 3.
Estimations of Equations (1)–(4) for renewable energy share in final energy consumption for EU and RO data.
Table 3.
Estimations of Equations (1)–(4) for renewable energy share in final energy consumption for EU and RO data.
| RE_EU Data | RE_RO Data | |||||||
|---|---|---|---|---|---|---|---|---|
| Model | Variable | Coefficient | Std.Err. | Prob. | Variable | Coefficient | Std.Err. | Prob. |
| Equation (1) | C | 9.235 | 0.243 | 0 | C | 17.042 | 0.678 | 0 |
| t | 0.687 | 0.025 | 0 | t | 0.569 | 0.070 | 0 | |
| Equation (2) | C | 8.313 | 0.252 | 0 | C | 14.522 | 0.730 | 0 |
| t | 0.994 | 0.068 | 0 | t | 1.409 | 0.198 | 0 | |
| t2 | −0.018 | 0.004 | 0 | t2 | −0.049 | 0.011 | 0.001 | |
| Equation (3) | C | 1.217 | 0.467 | 0.022 | C | 3.580 | 1.895 | 0.081 |
| RE_EU (−1) | 0.963 | 0.031 | 0 | RE_RO (−1) | 0.858 | 0.086 | 0 | |
| Equation (4) | C | 1.687 | 0.645 | 0.024 | C | 3.991 | 2.322 | 0.114 |
| RE_EU (−1) | 0.724 | 0.296 | 0.032 | RE_RO (−1) | 0.941 | 0.297 | 0.009 | |
| RE_EU (−2) | 0.218 | 0.284 | 0.457 | RE_RO (−2) | −0.102 | 0.270 | 0.713 | |
Table 4.
Estimations of Equations (1)–(4) for renewable energy share in electricity for EU and RO data.
Table 4.
Estimations of Equations (1)–(4) for renewable energy share in electricity for EU and RO data.
| RE_E_EU Data | RE_E_RO Data | |||||||
|---|---|---|---|---|---|---|---|---|
| Model | Variable | Coefficient | Std.Err. | Prob. | Variable | Coefficient | Std.Err. | Prob. |
| Equation (1) | C | 13.231 | 0.405 | 0 | C | 24.418 | 1.277 | 0 |
| t | 1.300 | 0.042 | 0 | t | 1.230 | 0.132 | 0 | |
| Equation (2) | C | 13.644 | 0.669 | 0 | C | 25.468 | 2.128 | 0 |
| t | 1.162 | 0.181 | 0 | t | 0.880 | 0.576 | 0.151 | |
| t2 | 0.008 | 0.010 | 0.449 | t2 | 0.021 | 0.033 | 0.543 | |
| Equation (3) | C | 0.672 | 0.691 | 0.348 | C | 1.953 | 2.586 | 0.464 |
| RE_E_EU (−1) | 1.023 | 0.028 | 0 | RE_E_RO (−1) | 0.969 | 0.074 | 0 | |
| Equation (4) | C | 0.838 | 0.806 | 0.321 | C | 2.902 | 2.471 | 0.265 |
| RE_E_EU (−1) | 1.194 | 0.297 | 0.002 | RE_E_RO (−1) | 1.484 | 0.253 | 0.000 | |
| RE_E_EU (−2) | −0.185 | 0.302 | 0.552 | RE_E_RO (−2) | −0.556 | 0.258 | 0.054 | |
Table 5.
Estimations of Equations (1)–(4) for renewable energy share in transport for EU and RO data.
Table 5.
Estimations of Equations (1)–(4) for renewable energy share in transport for EU and RO data.
| RE_T_EU Data | RE_T_RO Data | |||||||
|---|---|---|---|---|---|---|---|---|
| Model | Variable | Coeff. | Std.Err. | Prob. | Variable | Coeff. | Std.Err. | Prob. |
| Equation (1) | C | 1.480 | 0.242 | 0 | C | 0.017 | 0.485 | 0.973 |
| t | 0.453 | 0.025 | 0 | t | 0.448 | 0.050 | 0 | |
| Equation (2) | C | 1.198 | 0.398 | 0.010 | C | 1.189 | 0.709 | 0.118 |
| t | 0.547 | 0.108 | 0.000 | t | 0.058 | 0.192 | 0.769 | |
| t2 | −0.006 | 0.006 | 0.385 | t2 | 0.023 | 0.011 | 0.057 | |
| Equation (3) | C | 0.804 | 0.460 | 0.105 | C | 0.287 | 0.426 | 0.512 |
| RE_T_EU (−1) | 0.938 | 0.084 | 0 | RE_T_RO (−1) | 1.032 | 0.104 | 0 | |
| Equation (4) | C | 1.048 | 0.527 | 0.072 | C | 0.356 | 0.477 | 0.471 |
| RE_T_EU (−1) | 0.495 | 0.271 | 0.095 | RE_T_RO (−1) | 1.220 | 0.318 | 0.003 | |
| RE_T_EU (−2) | 0.440 | 0.264 | 0.123 | RE_T_RO (−2) | −0.220 | 0.332 | 0.521 | |
Table 6.
Estimations of Equations (1)–(4) for renewable energy share in heating and cooling for EU and RO data.
Table 6.
Estimations of Equations (1)–(4) for renewable energy share in heating and cooling for EU and RO data.
| RE_H&C_EU Data | RE_H&C_RO Data | |||||||
|---|---|---|---|---|---|---|---|---|
| Model | Variable | Coeff. | Std.Err. | Prob. | Variable | Coeff. | Std.Err. | Prob. |
| Equation (1) | C | 11.797 | 0.320 | 0 | C | 18.813 | 1.225 | 0 |
| t | 0.682 | 0.033 | 0 | t | 0.600 | 0.127 | 0 | |
| Equation (2) | C | 10.421 | 0.243 | 0 | C | 14.030 | 1.213 | 0 |
| t | 1.141 | 0.066 | 0 | t | 2.195 | 0.328 | 0 | |
| t2 | −0.027 | 0.004 | 0 | t2 | −0.094 | 0.019 | 0 | |
| Equation (3) | C | 1.785 | 0.613 | 0.012 | C | 5.504 | 2.622 | 0.056 |
| RE_H&C_EU (−1) | 0.937 | 0.035 | 0 | RE_H&C_RO (−1) | 0.792 | 0.109 | 0 | |
| Equation (4) | C | 3.004 | 0.797 | 0.003 | C | 6.869 | 3.063 | 0.047 |
| RE_H&C_EU (−1) | 0.410 | 0.269 | 0.156 | RE_H&C_RO (−1) | 0.958 | 0.279 | 0.006 | |
| RE_H&C_EU (−2) | 0.477 | 0.250 | 0.083 | RE_H&C_RO (−2) | −0.224 | 0.247 | 0.384 | |
Table 7.
Regression statistical coefficients for models (1)–(4).
| Model | R2 | SSR | AIC | Schwarz Crit. | R2 | SSR | AIC | Schwarz Crit. |
|---|---|---|---|---|---|---|---|---|
| RE_EU data | RE_RO data | |||||||
| Equation (1) | 0.982 | 2.997 | 1.413 | 1.509 | 0.825 | 23.428 | 3.469 | 3.566 |
| Equation (2) | 0.993 | 1.133 | 0.565 | 0.710 | 0.929 | 9.485 | 2.690 | 2.835 |
| Equation (3) | 0.987 | 1.749 | 0.956 | 1.050 | 0.883 | 12.382 | 2.913 | 3.007 |
| Equation (4) | 0.985 | 1.574 | 1.081 | 1.218 | 0.856 | 11.973 | 3.110 | 3.247 |
| RE_E_EU data | RE_E_RO data | |||||||
| Equation (1) | 0.986 | 8.350 | 2.438 | 2.534 | 0.861 | 83.060 | 4.735 | 4.831 |
| Equation (2) | 0.986 | 7.976 | 2.517 | 2.662 | 0.865 | 80.636 | 4.830 | 4.975 |
| Equation (3) | 0.990 | 5.042 | 2.014 | 2.109 | 0.929 | 38.990 | 4.060 | 4.154 |
| Equation (4) | 0.989 | 4.569 | 2.147 | 2.284 | 0.947 | 27.010 | 3.924 | 4.061 |
| RE_H&C_EU data | RE_H&C_RO data | |||||||
| Equation (1) | 0.968 | 5.205 | 1.965 | 2.061 | 0.616 | 76.435 | 4.652 | 4.748 |
| Equation (2) | 0.994 | 1.051 | 0.490 | 0.635 | 0.868 | 26.186 | 3.706 | 3.850 |
| Equation (3) | 0.982 | 2.248 | 1.206 | 1.301 | 0.803 | 30.153 | 3.803 | 3.897 |
| Equation (4) | 0.983 | 1.577 | 1.083 | 1.220 | 0.762 | 25.840 | 3.879 | 4.016 |
| RE_T_EU data | RE_T_RO data | |||||||
| Equation (1) | 0.959 | 2.988 | 1.410 | 1.506 | 0.851 | 11.967 | 2.797 | 2.894 |
| Equation (2) | 0.961 | 2.813 | 1.475 | 1.620 | 0.888 | 8.952 | 2.632 | 2.777 |
| Equation (3) | 0.905 | 5.459 | 2.094 | 2.188 | 0.884 | 8.802 | 2.571 | 2.666 |
| Equation (4) | 0.903 | 4.299 | 2.086 | 2.223 | 0.883 | 8.370 | 2.752 | 2.889 |
Table 8.
Analysis of the models (3) and (4) reliability.
| Equations * | Mean | F-Statistic | Prob. F | Durbin–Watson Stat. | Hom./Het. ** | Jarque–Bera | Test |
|---|---|---|---|---|---|---|---|
| Eq3_RE_EU | −7.14 × 10⁻¹⁶ | 1.560 | 0.25 | 2.317453 | Homoskedasticity | 1.320 | Valid |
| Eq3_RE_RO | −2.75 × 10⁻¹⁵ | 1.514 | 0.2593 | 2.826845 | Homoskedasticity | 1.121 | Valid |
| Eq3_RE_E_EU | −1.42 × 10⁻¹⁵ | 0.532 | 0.6008 | 2.705982 | Homoskedasticity | 1.418 | Valid |
| Eq3_RE_E_RO | 6.37 × 10⁻¹⁶ | 5.686 | 0.0183 | 1.622676 | Heteroskedasticity | 2.328 | Invalid |
| Eq3_RE_H&C_EU | −3.80 × 10⁻¹⁵ | 1.432 | 0.278 | 2.535801 | Homoskedasticity | 1.887 | Valid |
| Eq3_RE_H&C_RO | −2.42 × 10⁻¹⁵ | 0.407 | 0.6748 | 2.277051 | Homoskedasticity | 0.147 | Valid |
| Eq3_RE_T_EU | −1.10 × 10⁻¹⁵ | 0.637 | 0.5457 | 1.747289 | Homoskedasticity | 18.825 | Valid |
| Eq3_RE_T_RO | −5.48 × 10⁻¹⁶ | 0.426 | 0.6627 | 1.974916 | Homoskedasticity | 1.332 | Valid |
| Eq4_RE_EU | −2.22 × 10⁻¹⁵ | 3.651334 | 0.0512 | 2.118778 | Homoskedasticity | 0.264 | Valid |
| Eq4_RE_RO | 4.98 × 10⁻¹⁵ | 2.118399 | 0.165 | 1.838103 | Homoskedasticity | 1.693 | Valid |
| Eq4_RE_E_EU | −5.55 × 10⁻¹⁵ | 0.725469 | 0.6234 | 1.844998 | Homoskedasticity | 1.046 | Valid |
| Eq4_RE_E_RO | −7.62 × 10⁻¹⁶ | 15.42919 | 0.0006 | 2.888537 | Heteroskedasticity | 0.351 | Invalid |
| Eq4_RE_H&C_EU | −6.98 × 10⁻¹⁶ | 7.065776 | 0.0083 | 2.514238 | Heteroskedasticity | 0.999 | Invalid |
| Eq4_RE_H&C_RO | −1.72 × 10⁻¹⁵ | 1.336026 | 0.3402 | 1.741859 | Homoskedasticity | 1.0989 | Valid |
| Eq4_RE_T_EU | 1.02 × 10⁻¹⁵ | 0.507328 | 0.7642 | 2.31411 | Homoskedasticity | 37.80523 | Valid |
| Eq4_RE_T_RO | 1.17 × 10⁻¹⁵ | 3.541118 | 0.0552 | 2.296185 | Homoskedasticity | 1.023848 | Valid |
Note: * Denotes significance Eq3-Equation (3); Eq4-Equation (4); ** Denotes significance-Homoskedasticity/Heteroskedasticity.
Table 9.
Prediction of share of RE in final energy consumption for EU and Romania, horizon 2030.
| RE EU | RE Romania | |||||
|---|---|---|---|---|---|---|
| Model | 2020 | 2025 | 2030 | 2020 | 2025 | 2030 |
| Equation (1) | 20.91 | 24.34 | 27.77 | 26.71 | 29.56 | 32.40 |
| Equation (2) | 19.98 | 21.43 | 21.97 | 24.19 | 21.60 | 16.54 |
| Equation (3) | 20.22 | 22.41 | 24.23 | 24.42 | 24.86 | 25.06 |
| Equation (4) | 20.11 | 22.12 | 23.68 | 24.40 | 24.61 | 24.68 |
Table 10.
Prediction of share of RE in electricity consumption for EU and Romania, horizon 2030.
| RE_E EU | RE_E Romania | |||||
|---|---|---|---|---|---|---|
| Model | 2020 | 2025 | 2030 | 2020 | 2025 | 2030 |
| Equation (1) | 35.33 | 41.83 | 48.33 | 45.33 | 51.47 | 57.62 |
| Equation (2) | 35.74 | 43.13 | 50.93 | 46.38 | 54.79 | 64.24 |
| Equation (3) | 35.56 | 43.36 | 52.10 | 42.37 | 45.37 | 47.94 |
| Equation (4) | 35.59 | 42.80 | 50.37 | 41.56 | 40.79 | 40.43 |
Table 11.
Prediction of share of RE in transport sector for EU and Romania, horizon 2030.
| RE_T EU | RE_T Romania | |||||
|---|---|---|---|---|---|---|
| Model | 2020 | 2025 | 2030 | 2020 | 2025 | 2030 |
| Equation (1) | 9.18 | 11.45 | 13.72 | 7.64 | 9.88 | 12.12 |
| Equation (2) | 8.90 | 10.56 | 11.94 | 8.81 | 13.57 | 19.49 |
| Equation (3) | 9.16 | 10.21 | 10.98 | 8.39 | 11.36 | 14.85 |
| Equation (4) | 9.11 | 10.58 | 11.73 | 8.53 | 10.87 | 13.15 |
Table 12.
Prediction of share of RE in heating and cooling sector for EU and Romania, horizon 2030.
| RE_H&C EU | RE_H&C Romania | |||||
|---|---|---|---|---|---|---|
| Model | 2020 | 2025 | 2030 | 2020 | 2025 | 2030 |
| Equation (1) | 23.40 | 26.81 | 30.22 | 29.02 | 32.02 | 35.02 |
| Equation (2) | 22.02 | 22.47 | 21.57 | 24.23 | 16.92 | 4.91 |
| Equation (3) | 22.17 | 23.68 | 24.64 | 25.89 | 26.30 | 26.43 |
| Equation (4) | 22.48 | 24.09 | 25.24 | 25.84 | 25.87 | 25.87 |
Table 13.
Unit root test—augmented Dickey–Fuller statistic test.
| RE | RE_E | RE_T | RE_H&C | ||||||
|---|---|---|---|---|---|---|---|---|---|
| EU | RO | EU | RO | EU | RO | EU | RO | ||
| Level | |||||||||
| t-Statistic | −1.19 | −1.64 | 0.81 | −1.01 | −0.70 | 0.31 | −2.82 *** | −1.91 | |
| Prob. * | 0.65 | 0.44 | 0.99 | 0.72 | 0.82 | 0.97 | 0.08 | 0.32 | |
| Test critical values | 1% level | −3.96 | −3.96 | −3.96 | −4.00 | −4.00 | −3.96 | −4.00 | −3.96 |
| 5% level | −3.08 | −3.08 | −3.08 | −3.10 | −3.10 | −3.08 | −3.10 | −3.08 | |
| 10% level | −2.68 | −2.68 | −2.68 | −2.69 | −2.69 | −2.68 | −2.69 | −2.68 | |
| First Difference | |||||||||
| t-Statistic | −3.82 ** | −3.03 *** | −2.81 *** | −1.97 | −5.68 * | −3.01 *** | −4.13 * | −2.72 *** | |
| Prob. * | 0.01 | 0.06 | 0.08 | 0.29 | 0.00 | 0.06 | 0.01 | 0.09 | |
| Test critical values | 1% level | −4.00 | −4.00 | −4.00 | −4.00 | −4.00 | −4.06 | −4.00 | −4.00 |
| 5% level | −3.10 | −3.10 | −3.10 | −3.10 | −3.1 | −3.12 | −3.10 | −3.10 | |
| 10% level | −2.69 | −2.69 | −2.69 | −2.69 | −2.69 | −2.70 | −2.69 | −2.69 | |
Note: * Denotes significance at 10% level, ** denotes significance at 5% level, *** denotes significance at 1% level.
Table 14.
The degree of correlation between variables.
| Covariance Correlation | ||||
|---|---|---|---|---|
| Probability | RE_EU | RE_E_EU | RE_H&C_EU | RE_T_EU |
| RE_EU | 10.20344 | |||
| 1.000000 | ||||
| ----- | ||||
| RE_E_EU | 19.04310 | 36.43505 | ||
| 0.987654 | 1.000000 | |||
| 0.0000 | ----- | |||
| RE_H&C_EU | 10.18221 | 18.82907 | 10.22155 | |
| 0.997035 | 0.975688 | 1.000000 | ||
| 0.0000 | 0.0000 | ----- | ||
| RE_T_EU | 6.693528 | 12.40327 | 6.677785 | 4.550670 |
| 0.982300 | 0.963250 | 0.979121 | 1.000000 | |
| 0.0000 | 0.0000 | 0.0000 | ----- | |
Table 15.
Johansen cointegration test.
| Sample (Adjusted): 2006–2019 | ||||||||
|---|---|---|---|---|---|---|---|---|
| Included Observations: 14 after Adjustments | ||||||||
| Lags Interval (in First Differences): 1 to 1 | ||||||||
| Unrestricted Cointegration Rank Test (Trace) | ||||||||
| Hypothesized | Trace | 0.05 | ||||||
| Series: RE RE_E RE_H&C_EU RE_T | ||||||||
| No. of CE(s) | European Union | Romania | ||||||
| Eigen Value | Statistic | Critical Value | Prob. ** | Eigen Value | Statistic | Critical Value | Prob. ** | |
| None * | 0.920 | 82.356 | 47.856 | 0 | 0.937 | 93.574 | 47.856 | 0 |
| At most 1 * | 0.909 | 46.992 | 29.797 | 0.0002 | 0.892 | 54.865 | 29.797 | 0 |
| At most 2 | 0.611 | 13.512 | 15.495 | 0.0973 | 0.778 | 23.769 | 15.495 | 0.0023 |
| At most 3 | 0.020 | 0.282 | 3.842 | 0.5957 | 0.175 | 2.692 | 3.841 | 0.1008 |
Note: trace test indicates two cointegrating eqs. at the 0.05 level. * denotes rejection of the hypothesis at the 0.05 level. ** MacKinnon–Haug–Michelis (1999) p-values.
Table 16.
Pairwise Granger causality tests.
| Null Hypothesis: | European Union | Romania | ||||
|---|---|---|---|---|---|---|
| F-Stat. | Prob. | Concl. | F-Stat. | Prob. | Concl. | |
| RE_E does not Granger Cause RE | 2.075 | 0.182 | Reject | 0.683 | 0.530 | Reject |
| RE does not Granger Cause RE_E | 1.998 | 0.191 | Reject | 0.89 | 0.444 | Reject |
| RE_H&C does not Granger Cause RE | 0.436 | 0.670 | Reject | 0.029 | 0.971 | Reject |
| RE does not Granger Cause RE_H&C | 0.024 | 0.977 | Reject | 0.047 | 0.955 | Reject |
| RE_T does not Granger Cause RE | 0.604 | 0.567 | Reject | 0.52 | 0.612 | Reject |
| RE does not Granger Cause RE_T | 0.758 | 0.496 | Reject | 6.76 | 0.016 | Accept |
Table 17.
White heteroskedasticity test.
| EU_27 | RO | EU_27 | RO | ||
|---|---|---|---|---|---|
| F-statistic | 0.824383 | 0.421350 | Prob. F (9,6) | 0.6188 | 0.8824 |
| Obs * R-squared | 8.846201 | 6.196231 | Prob. Chi-Square (9) | 0.4516 | 0.7201 |
| Scaled explained SS | 3.840563 | 1.374437 | Prob. Chi-Square (9) | 0.9216 | 0.9980 |
Table 18.
Regression coefficients for Equation (5).
| R-Squared | F-Statistic | Prob (F-Statistic) | Durbin– Watson Stat | |
|---|---|---|---|---|
| EU | 0.999005 | 4014.834 | 0 | 1.698986 |
| RO | 0.996559 | 1158.597 | 0 | 1.709706 |
Table 19.
Estimations of Equation (5) for EU and RO data.
| Dependent Variable: RE | ||||||||
|---|---|---|---|---|---|---|---|---|
| Method: Least Squares | ||||||||
| Sample: 2004–2019 | ||||||||
| Included Observations: 16 | ||||||||
| Variable | European Union | Romania | ||||||
| Coeff. | Std.Err. | t-Stat. | Prob. | Coeff. | Std.Err. | t-Stat. | Prob. | |
| C | −0.35498 | 0.457132 | −0.77654 | 0.4525 | 2.200638 | 0.542565 | 4.055989 | 0.0016 |
| RE_E | 0.155778 | 0.022347 | 6.970751 | 0 | 0.188085 | 0.023492 | 8.006408 | 0 |
| RE_T | 0.135770 | 0.068176 | 1.99148 | 0.0697 | 0.032550 | 0.057372 | 0.567359 | 0.5809 |
| RE_H&C | 0.620493 | 0.055751 | 11.12967 | 0 | 0.543352 | 0.019301 | 28.15131 | 0 |
Publisher’s Note: MDPI stays neutral with regard to jurisdictional claims in published maps and institutional affiliations. |
© 2021 by the authors. Licensee MDPI, Basel, Switzerland. This article is an open access article distributed under the terms and conditions of the Creative Commons Attribution (CC BY) license (https://creativecommons.org/licenses/by/4.0/).
Share and Cite
MDPI and ACS Style
Mehedintu, A.; Soava, G.; Sterpu, M.; Grecu, E. Evolution and Forecasting of the Renewable Energy Consumption in the Frame of Sustainable Development: EU vs. Romania. Sustainability 2021, 13, 10327. https://doi.org/10.3390/su131810327
AMA Style
Mehedintu A, Soava G, Sterpu M, Grecu E. Evolution and Forecasting of the Renewable Energy Consumption in the Frame of Sustainable Development: EU vs. Romania. Sustainability. 2021; 13(18):10327. https://doi.org/10.3390/su131810327
Chicago/Turabian StyleMehedintu, Anca, Georgeta Soava, Mihaela Sterpu, and Eugenia Grecu. 2021. "Evolution and Forecasting of the Renewable Energy Consumption in the Frame of Sustainable Development: EU vs. Romania" Sustainability 13, no. 18: 10327. https://doi.org/10.3390/su131810327
Note that from the first issue of 2016, this journal uses article numbers instead of page numbers. See further details here.